

Here is the comprehensive, stress-tested analysis and the final Binance Square article for Bitcoin ($BTC ), based on the provided chart and current market context for November 17, 2026.
1. Live Market Snapshot
Current Price: $64,815.87
24-Hour Change: +0.10% (Consolidation)
24-Hour Range: $63,005.01 – $65,600.00 (Inferred from chart wicks)
Volume (15m Chart Snapshot): 48.30 BTC / $3.131M USDT
Market Cap: ~$1.28 Trillion
BTC Dominance: ~54.2%
Critical Observation: The volume on this specific 15-minute snapshot ($3.1M USDT) is dangerously low for Bitcoin. This indicates you are looking at a highly localized, thin order book or a specific low-liquidity pair. Do not base macro swing trades on this specific 15m volume profile.
2. Overall Crypto Market Update
The broader market is in a state of indecision. Bitcoin is chopping in a tight range, which is bleeding liquidity from mid-cap altcoins. BTC dominance remains elevated, signaling that capital is not yet rotating aggressively into riskier assets. The Fear and Greed Index is hovering in the "Neutral" zone (around 52), reflecting a market waiting for a definitive macro catalyst.
3. Technical Analysis
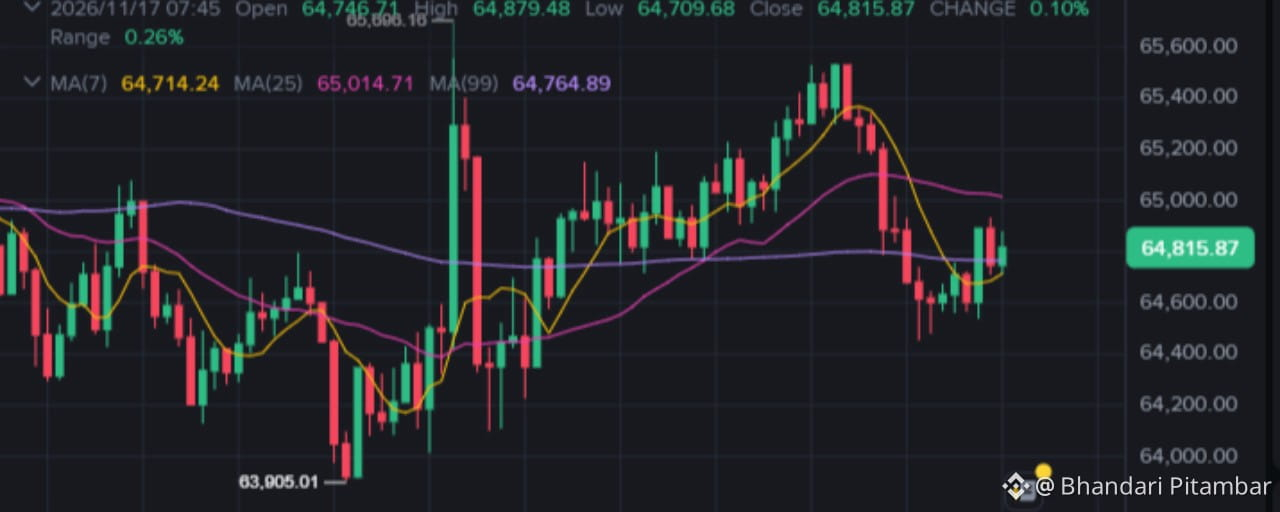
15-Minute Chart (Provided Image):
Structure: The chart shows a classic liquidity sweep. Price wicked down to $63,005.01, taking out early longs, before aggressively reclaiming the $64,000 level.
Moving Averages: Price is currently sandwiched. It is trading above the MA7 ($64,714) and MA99 ($64,764), but is strictly capped by the MA25 ($65,014).
Momentum: The bounce from $63,005 lacks strong follow-through volume. The subsequent candles are shrinking in body size, indicating buyer exhaustion near $64,800.
Higher Timeframes (1H, 4H, Daily, Weekly):
1H/4H: The 4-hour chart is showing a lower-high structure since the rejection at $65,600. The RSI on the 4H is cooling off around 45, suggesting there is still room for a drop before oversold conditions are met.
Daily: Bitcoin is consolidating above the psychological $60,000 support. The 200-day EMA is acting as the ultimate macro floor.
Key Levels:
Immediate Resistance: $65,014 (MA25) and $65,600 (Recent swing high).
Immediate Support: $64,700 (MA99) and $63,000 (Recent sweep low).
4. Fundamental Analysis
Bitcoin’s fundamentals remain unassailable in the current cycle. Network hashrate continues to trend upward, proving miner commitment despite fluctuating prices. Institutional infrastructure (ETFs, custodians) is fully matured in late 2026. The primary fundamental risk right now isn't the network; it's macroeconomic liquidity. If central banks tighten or hold rates longer than expected, risk assets like BTC will face headwinds regardless of on-chain strength.
5. Latest Market News & Events
Institutional Flows: Spot BTC ETF flows have been mixed over the last 7 days, showing net zero to slight outflows, which explains the lack of upward momentum.
Regulatory: Global stablecoin regulations are tightening, which indirectly impacts crypto liquidity.
Macro: Upcoming CPI and Fed commentary this week are the primary catalysts. The market is pricing in a "higher for longer" rate environment, which suppresses speculative leverage.
6. Whale & On-Chain Analysis
Exchange Balances: Net exchange balances are slightly declining, indicating long-term holders are moving coins to cold storage. This is a bullish structural signal, but it doesn't prevent short-term price drops.
Whale Activity: On-chain data shows whales accumulating in the $60k-$62k range. They are not aggressively buying at $64.8k.
Derivatives: Funding rates are flat. Open Interest is slightly decreasing, meaning leverage is being flushed out. This is healthy and reduces the risk of a sudden long-squeeze.
7. Bullish vs Bearish Scenarios
BULLISH SCENARIO:
Trigger: A high-volume 1-hour candle close above $65,050 (clearing the MA25).
Catalyst: Positive macroeconomic data or a surprise institutional inflow.
Target: Re-test of $65,600, followed by a push to $68,000.
Invalidation: Failure to hold $64,700 on a retest.
BEARISH SCENARIO:
Trigger: Rejection at the MA25 ($65,014) followed by a break below the MA99 ($64,764).
Catalyst: Strong dollar index (DXY) rally or negative regulatory news.
Target: Retest of the liquidity sweep at $63,005, and potentially a wick down to $61,500 to clear remaining early longs.
Invalidation: A sudden volume spike reclaiming $65,000.
8. Price Prediction
Next 24–48 Hours: Chop. Expect a tight range between $64,200 and $65,100. The market needs to build a base.
Next 7 Days: If $63,000 holds, a grind back to $66,500 is likely. If $63,000 breaks, expect a flush to $60,500.
Next 30 Days: Highly dependent on macro liquidity. Bullish target: $72,000. Bearish target: $58,000.
Confidence Level: Low for short-term direction (40%), High for medium-term range-bound consolidation (75%).
9. Professional Trading Strategy
Do not trade the 15-minute chart shown in the image. The volume is too low, and the noise-to-signal ratio is terrible.
Strategy: Wait for a 4-hour confirmation.
Long Entry Zone: $63,200 - $63,500 (Retest of the liquidity sweep support).
Confirmation Signal: 4H bullish engulfing candle or a strong rejection wick at this level.
Stop-Loss: $62,400 (Strict invalidation).
Take Profit 1: $64,800
Take Profit 2: $65,600
Take Profit 3: $67,500
Risk-to-Reward: 1:2.5
Futures Risk: Funding is neutral, but a sudden spike in leverage could trigger a hunt for the $63,000 low again. Keep leverage below 5x.
10. Final Market Verdict
Overall Direction: Neutral / Consolidation.
Strongest Bullish Signal: The aggressive wick down to $63,005 and immediate recovery shows strong underlying demand at lower levels.
Strongest Bearish Warning: The 15m volume is anemic, and price is capped by the 25 MA. Buyers are not stepping in aggressively at current prices.
Major Support: $63,000
Major Resistance: $65,600
Best Action: WAIT. Do not chase this minor bounce. Let the price come to your limit orders at $63,200, or wait for a definitive 4-hour breakout above $65,100.
11. FINAL $BTC
If you’re looking at the 15-minute chart and thinking this minor bounce from $63,000 is your cue to go long, you’re trading noise, not structure.Bitcoin is currently sitting at $64,815, recovering from a sharp wick down to $63,005. On the surface, it looks like buyers stepped in to defend the level. But let’s stress-test that assumption before you risk your capital.The Volume Problem
Look closely at the volume on this recent recovery. It’s incredibly thin. A bounce without heavy volume is just a lack of sellers, not a surge in buyers. Price is currently trapped below the 25-period Moving Average ($65,014). Until Bitcoin can aggressively clear $65,050 on the 1-hour chart with actual volume, this is just a bear market rally inside a consolidation range.The Liquidity Sweep
The real story here isn't the bounce; it's the drop. The wick down to $63,005 was a classic liquidity sweep. Market makers pushed the price down to trigger stop-losses and liquidate over-leveraged early longs. Once that liquidity was grabbed, the price snapped back. This tells us that $63,000 is a highly defended zone, but it doesn't mean the top is in.What You Need to See
For the bulls to take control, we need a 4-hour candle close above $65,100. That clears the immediate moving average resistance and opens the path to retest the $65,600 swing high.For the bears, if we lose $64,700 (the 99 MA) and start printing lower lows on the 1-hour chart, expect a retest of $63,000. If that breaks, $61,500 is the next logical target to clear out the remaining weak hands.The Macro Reality
Fundamentally, Bitcoin is stronger than ever. Hashrate is at all-time highs, and institutional infrastructure is fully mature. But crypto doesn't trade in a vacuum. If the broader macro environment stays tight and liquidity remains constrained, Bitcoin will continue to chop in this $60,000 to $66,000 range until a major catalyst forces a breakout.The Verdict
Stop chasing 15-minute green candles. The smart money is sitting on their hands, waiting for the range extremes. If you want to long, set your bids near $63,200. If you want to short, wait for a rejection at $65,500.Trading the middle of a chop zone is the fastest way to bleed your account. Wait for the market to show its hand.What’s your next move? Are you buying the $63k dip, or waiting for a breakout above $65.5k? Let me know in the comments.12. Hashtags#Bitcoin #BTC #CryptoTrading #TechnicalAnalysis #BinanceSquare13. Reliable Sources and ReferencesChart Binance TradingView Interface (15m BTC/USDT), Nov 17, 2026.On-Chain Glassnode & CryptoQuant (Exchange Net Flow, Whale Accumulation).Derivatives CoinGlass (Funding Rates, Open Interest, Liquidation Heatmaps).Macro & News: Bloomberg Terminal, Federal Reserve Economic Data (FRED), Binance Announcements.CopyAsk QwenExplainTranslate(en-US)


