

Hyperliquid's HYPE is trading around $66.78, showing a modest 24-hour gain of approximately 0.66% in the supplied Binance Futures snapshot.
But is this the beginning of a recovery, or just a temporary pause in a broader downtrend?
Let's examine all four timeframes.
1. 15-Minute Chart: A Small Recovery Signal
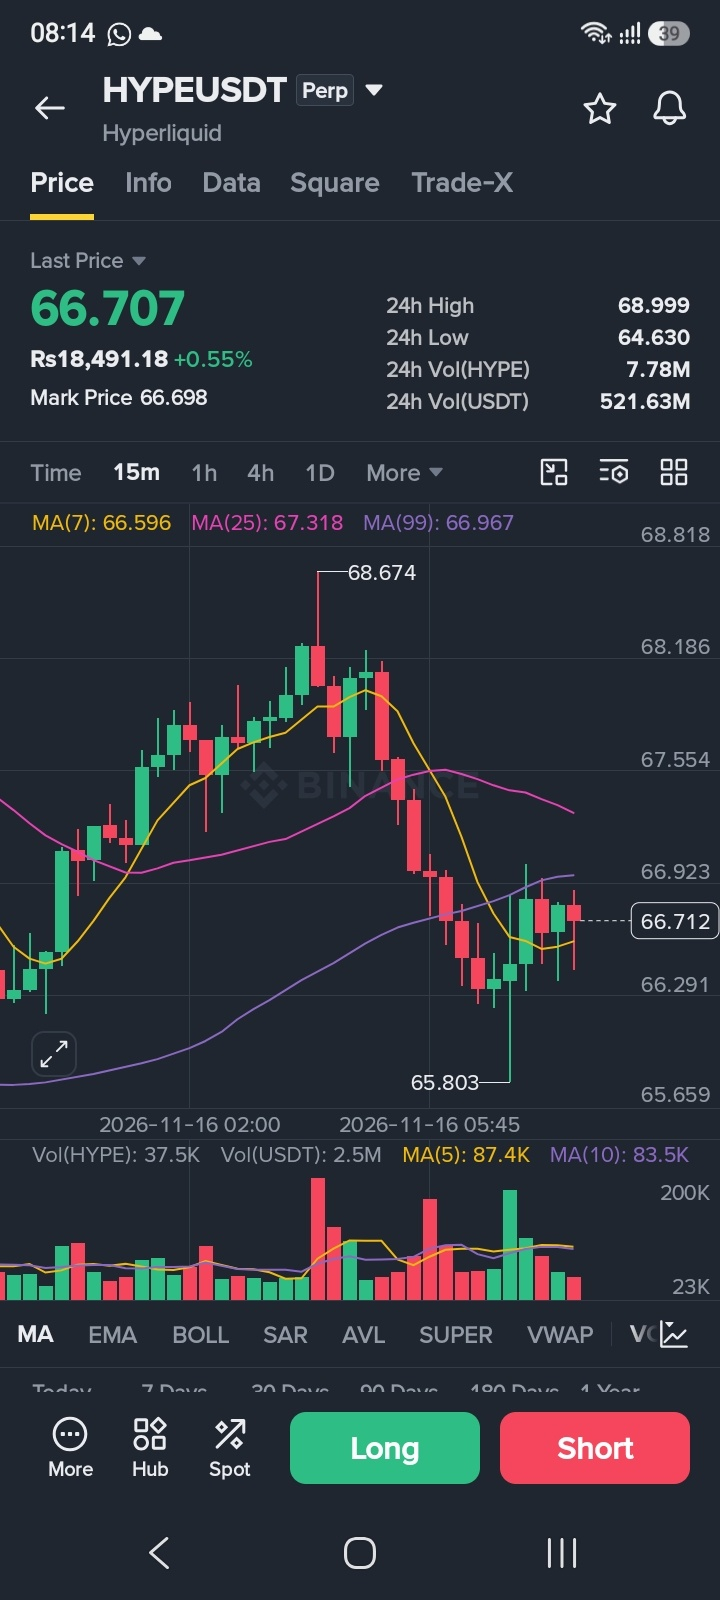
MA(7): $66.596
MA(25): $67.318
MA(99): $66.967
Candle volume: 37.5K
MA(5) Volume: 87.4K
MA(10) Volume: 83.5K
Price is above MA(7), but remains below MA(25) and MA(99). This suggests a short-term bounce, not a confirmed bullish reversal.
Volume is also below both averages, showing limited buying participation.
2. 1-Hour Chart: Sellers Still Have an Advantage
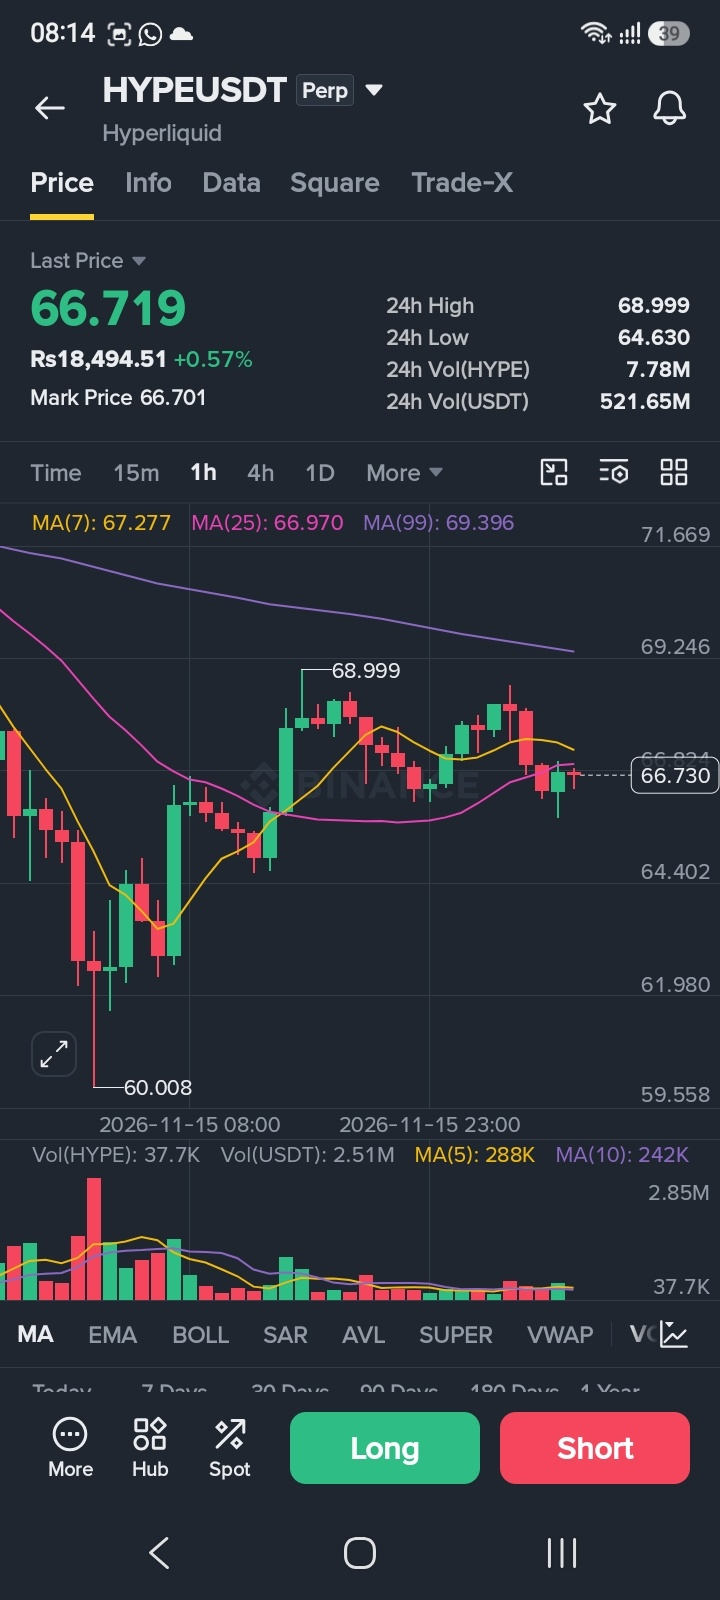
MA(7): $67.277
MA(25): $66.970
MA(99): $69.396
Candle volume: 37.7K
MA(5) Volume: 288K
MA(10) Volume: 242K
HYPE is trading below all three moving averages on this timeframe.
The $67.00–$67.28 area is an important resistance zone. A recovery above it would be an early improvement, while MA(99) near $69.40 remains a larger hurdle.
3. 4-Hour Chart: The Bigger Resistance
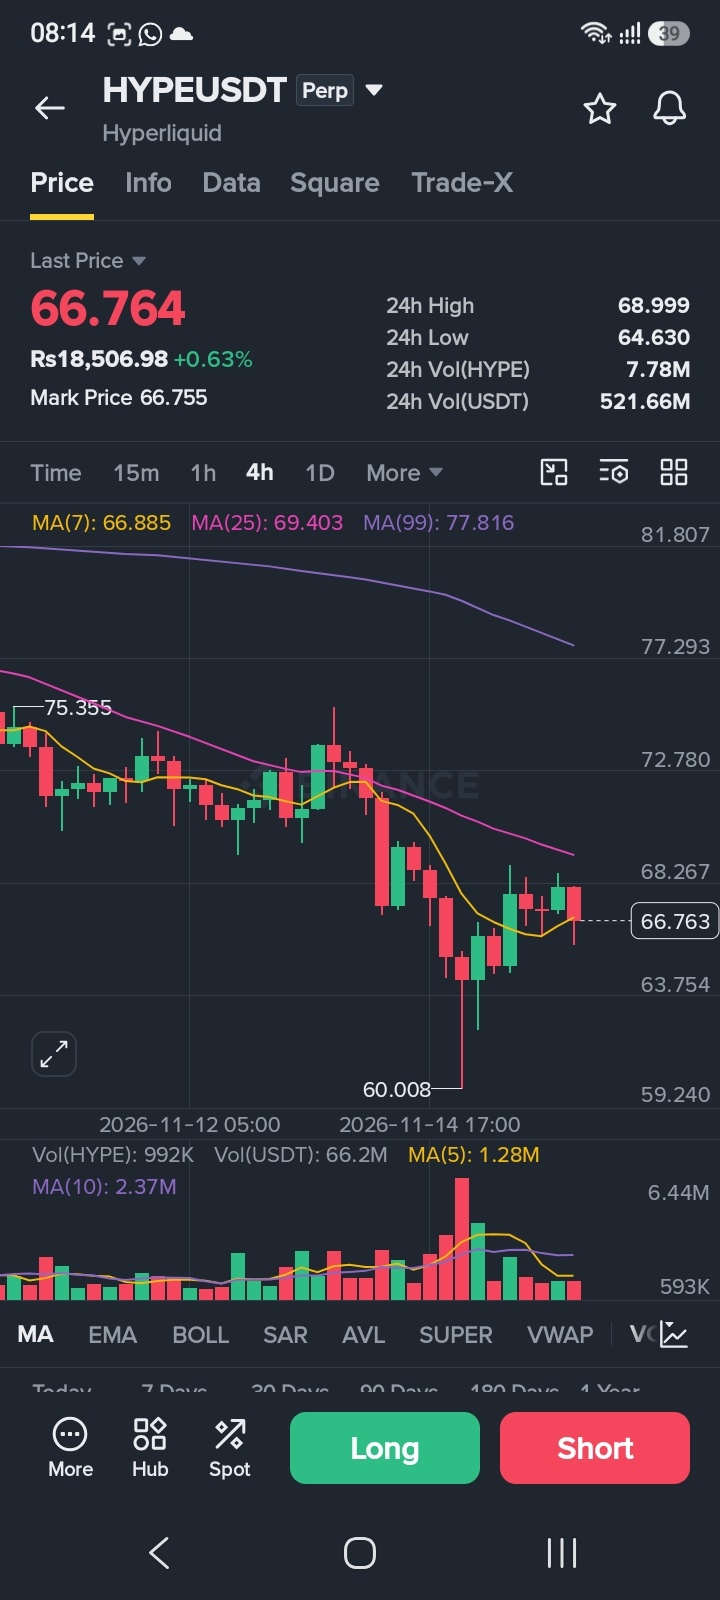
MA(7): $66.885
MA(25): $69.403
MA(99): $77.816
Candle volume: 992K
MA(5) Volume: 1.28M
MA(10) Volume: 2.37M
Price is slightly below MA(7) and significantly below MA(25) and MA(99).
This timeframe shows that the broader recovery is still facing resistance. Volume is also weaker than both averages.
4. Daily Chart: Long-Term Pressure Remains
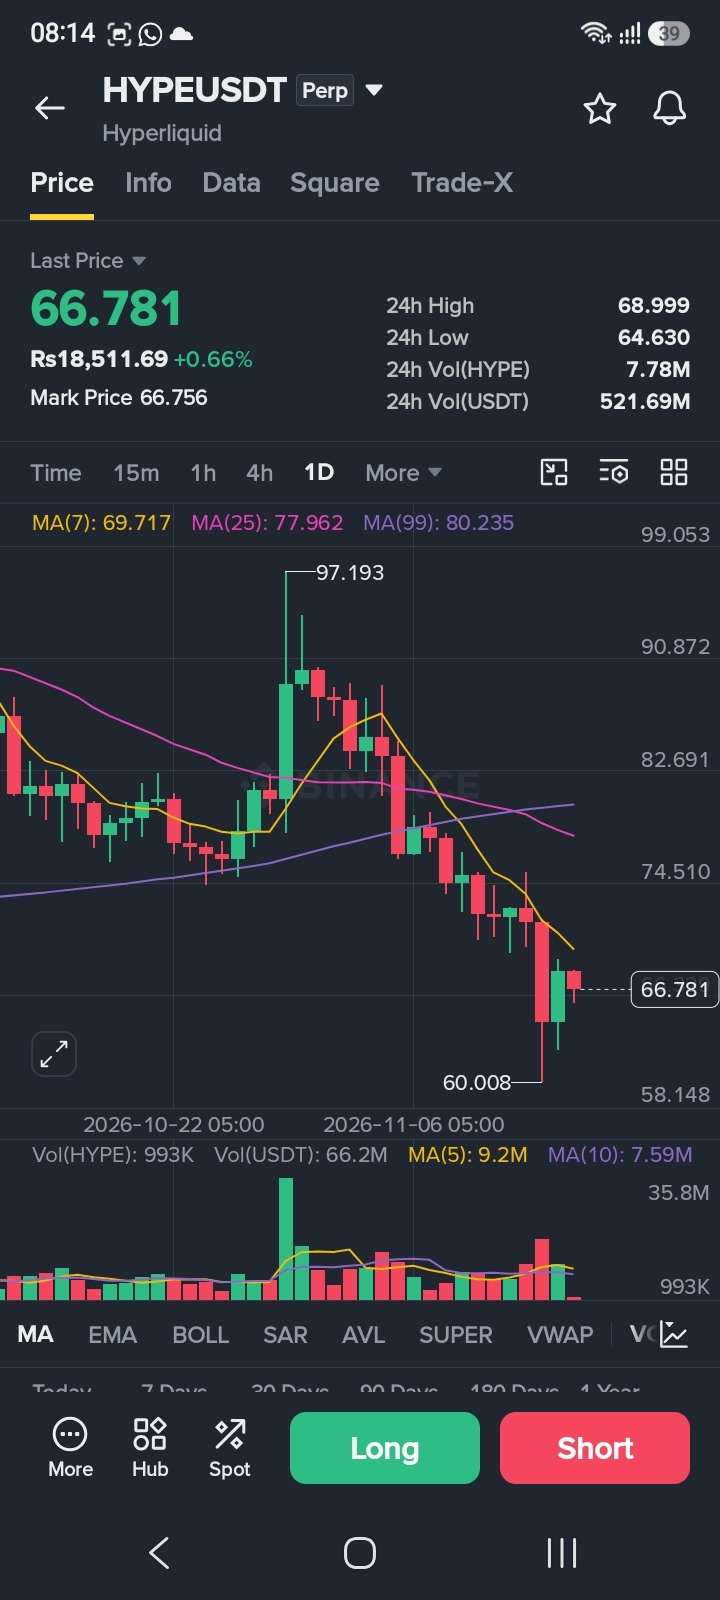
MA(7): $69.717
MA(25): $77.962
MA(99): $80.235
Candle volume: 993K
MA(5) Volume: 9.2M
MA(10) Volume: 7.59M
The daily chart is the biggest warning sign.
HYPE is trading below all three moving averages, indicating that the broader trend remains under pressure.
Daily volume is also considerably below its averages in this snapshot.
Key Support and Resistance Levels
Resistance zones:
$66.97–$67.32
$68.999
$69.40–$69.72
$77.96
Support zones:
$66.59
$64.63
A convincing move above $69.72 with stronger volume could improve the bullish outlook. However, losing the $64.63 support could expose HYPE to further downside pressure.
Final Verdict: Can HYPE Recover?
The 15-minute chart shows a small recovery attempt, but the 1H, 4H and Daily charts remain under bearish pressure.
The biggest missing ingredient is volume confirmation.
My observation: HYPE needs to reclaim important moving averages and attract stronger buying volume before a sustainable bullish reversal can be considered.

What is your prediction?
🚀 HYPE will recover above $70
🐻 HYPE will test lower support
⚖️ HYPE will remain sideways
Share your view in the comments!
Disclaimer: This article is based on the Binance Futures chart snapshots supplied for analysis. It is for educational and informational purposes only, not financial advice. Always manage risk.
#HYPE #Hyperliquid #BinancePick #CryptoAnalysis #TechnicalAnalysis #cryptotrading