


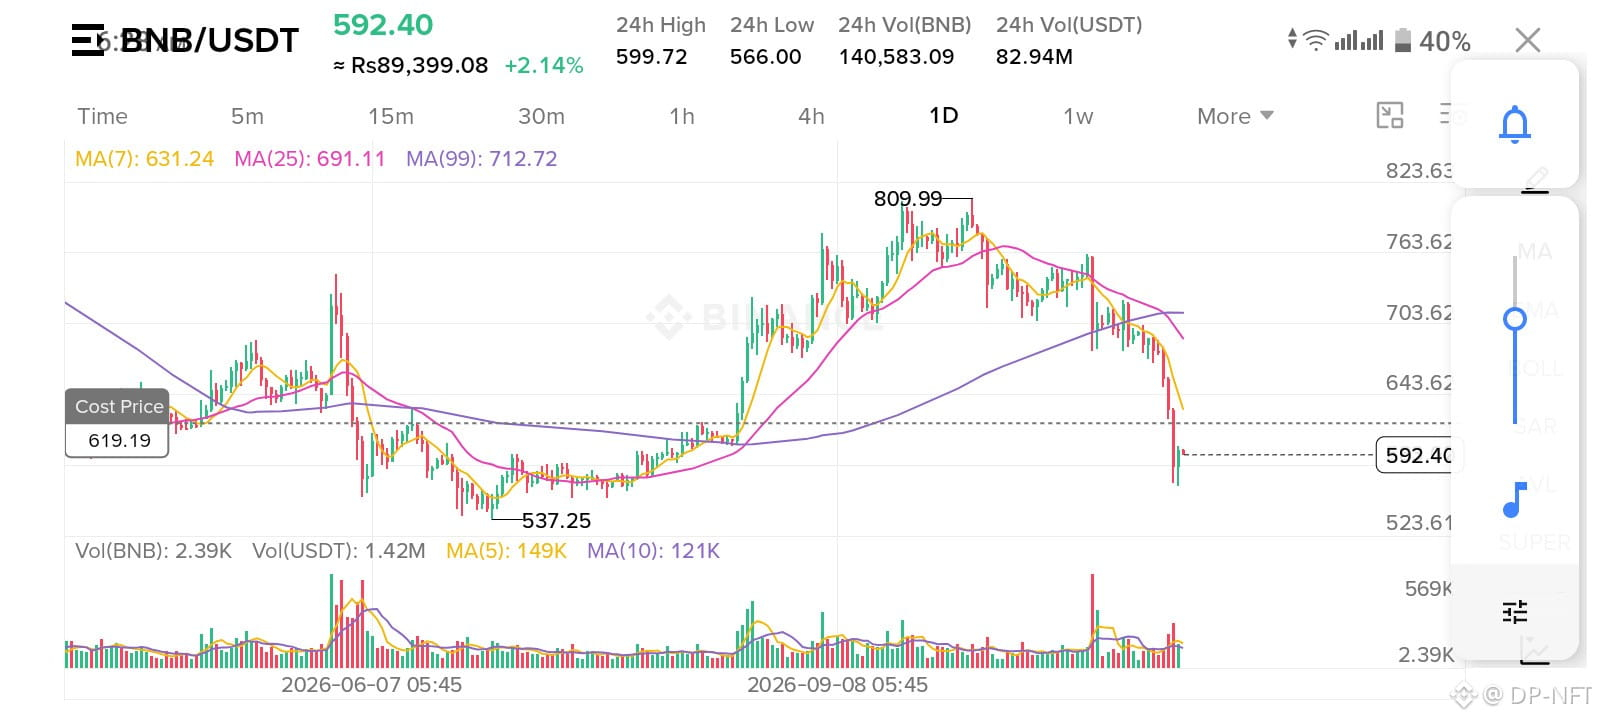
BNB/USDT Technical Analysis | November 16, 2026
BNB is currently trading around $592.40, showing signs of significant bearish pressure on the daily (1D) chart. Despite a 24-hour gain of approximately 2.14%, the broader technical structure remains weak.
After falling sharply from its recent high near $809.99, BNB is now trading below all three major moving averages. This raises an important question: Is this a temporary correction, or could further downside be ahead?
Let's examine the key technical levels and possible market scenarios.
1. Current Market Overview
Based on the Binance chart:
- Current Price: $592.40
- 24H High: $599.72
- 24H Low: $566.00
- 24H Change: +2.14%
- MA(7): $631.24
- MA(25): $691.11
- MA(99): $712.72
The price is currently below all three moving averages, indicating bearish momentum across short-, medium-, and longer-term trends.
2. Key Support Levels
These are the important support zones to monitor:
Support 1: $566
This is the immediate support area. If buyers successfully defend this level, BNB could attempt a short-term recovery.
Support 2: $537
This is a significant historical support zone. A breakdown below $566 could bring this level into focus.
A sustained move below $537 would increase the risk of further downside.
3. Key Resistance Levels
BNB needs to reclaim several resistance zones before a meaningful trend reversal can be considered.
- Resistance 1: $619–$631
- Resistance 2: $643–$660
- Resistance 3: $691–$713
The $619–$631 zone is particularly important because it overlaps with the short-term moving average area.
A strong daily close above this zone, supported by increasing trading volume, could provide the first indication of improving bullish momentum.
4. Moving Average Analysis
The current moving average structure is bearish:
- MA(7): $631.24
- MA(25): $691.11
- MA(99): $712.72
BNB trading below all three averages suggests that sellers currently have the technical advantage.
Until the price reclaims these levels, traders should remain cautious about assuming that a major bullish reversal has started.
5. Possible Market Scenarios
Scenario A: Bearish Continuation
If BNB loses the $566 support level, the next important downside area to watch is $537.
A decisive breakdown below $537 could signal additional selling pressure.
Scenario B: Bullish Recovery
If BNB holds above $566 and buying pressure increases, a recovery toward $619–$631 becomes possible.
A confirmed daily breakout above $631 could open the way toward $643–$660.
Further strength above $660 would improve the recovery outlook, while $691–$713 remains a major resistance zone.
6. My Trading Perspective
At the current price, chasing a trade without confirmation could be risky.
My approach would be:
- Avoid aggressive buying before support confirmation.
- Watch the $566 level for a potential bullish reaction.
- Monitor $537 as a major downside support.
- Look for a strong daily close above $631 before considering a stronger recovery.
- Use proper stop-loss management and position sizing.
Patience is important in volatile market conditions. Waiting for confirmation is often better than trying to predict the exact bottom.
Final Thoughts
BNB is currently showing a bearish technical structure, but the $566 and $537 support zones could play an important role in determining its next move.
The coming daily candles may provide more clarity about whether BNB is preparing for a recovery or continuing its correction.
What do you think? Will BNB recover toward $650, or will it test $537 first?
Share your analysis and thoughts in the comments!
Disclaimer: This article is for educational and informational purposes only. It is not financial or investment advice. Cryptocurrency markets are highly volatile. Always conduct your own research (DYOR) and manage your risk before making trading decisions.
#BNB #BNBAnalysis #BNBUSDT #CryptoAnalysis #BinanceSquare

