

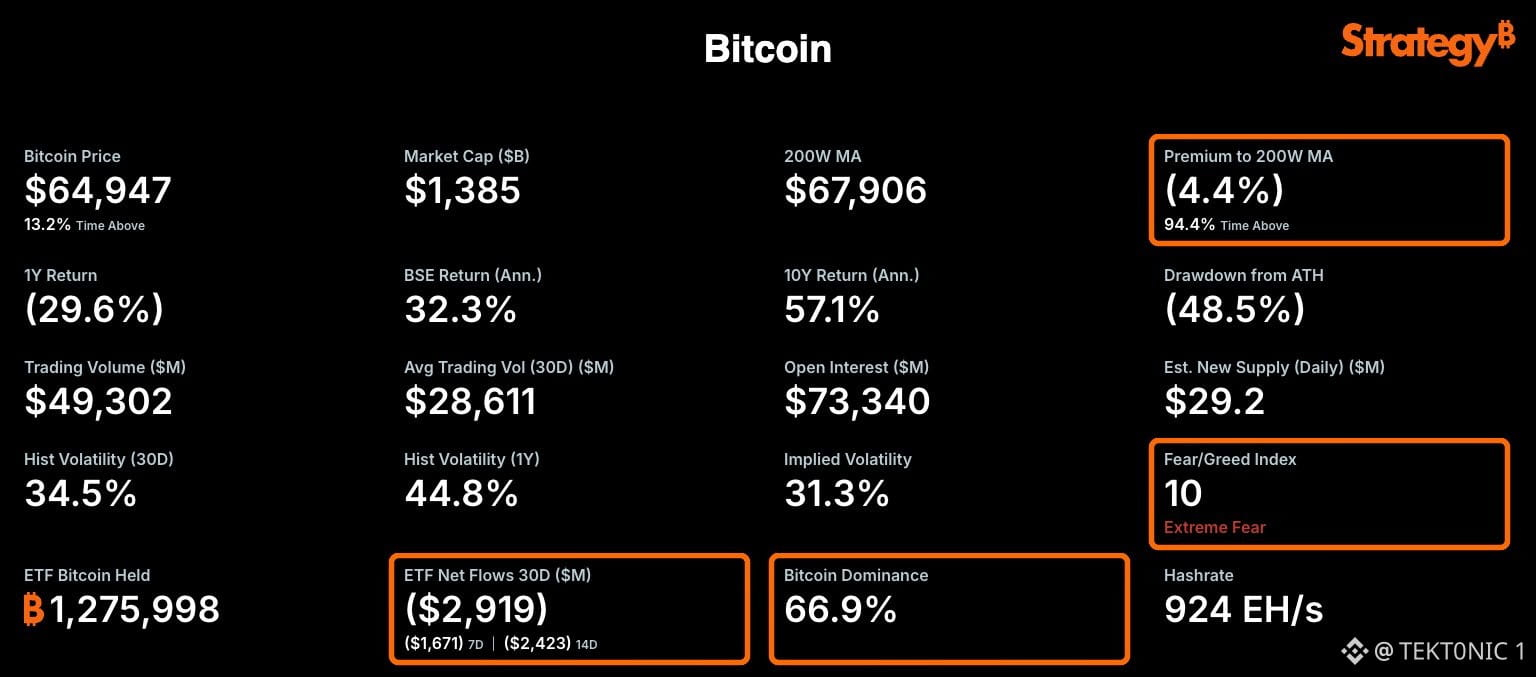
strategy’s bitcoin dashboard shows price at $64,947, a 48.5% drawdown from the all-time high, and a fear and greed index reading of 10. 👀 the snapshot lists a market cap of $1.385 trillion, a 200-week moving average of $67,906, and a 4.4% premium to that average. thirty-day etf net flows are negative $2.919 billion, while $BTC dominance sits at 66.9%. hash rate is reported at 924 eh/s and etf bitcoin held stands at 1,275,998 coins. one-year return is negative 29.6%, and 30-day historical volatility is 34.5%. the combination of a deep drawdown, extreme fear reading, and sustained etf outflows points to compressed sentiment and reduced institutional inflows. price trading just below the 200-week moving average places it near a long-term reference level that has held in prior cycles. the negative 30-day etf flows confirm that the products have been net sellers over the past month, consistent with the broader shift into red territory for 2026. the dashboard aggregates these figures into a single view. the current readings show price under pressure, sentiment at extreme fear, and etf flows still negative while the network hash rate remains elevated. the data provides a clear snapshot of the present market conditions. #BTC Price Analysis# #Bitcoin Price Prediction: What is Bitcoins next move?# #Strategy $BTC $SOL
انضم إلى مُستخدمي العملات الرقمية حول العالم على Binance Square
⚡️ احصل على أحدث المعلومات المفيدة عن العملات الرقمية.
💬 موثوقة من قبل أكبر منصّة لتداول العملات الرقمية في العالم.
👍 اكتشف الرؤى الحقيقية من صنّاع المُحتوى الموثوقين.
البريد الإلكتروني / رقم الهاتف