First, I want to see $NEAR defend its current support region
and establish a clear sequence of higher lows.
A sustained weekly reclaim of $5 would be the first encouraging signal.
Breaking above $7–10 with expanding volume would strengthen the bullish thesis considerably.
And a decisive move above $20 would represent a major structural shift, potentially opening the door to price discovery.
Without those confirmations, the broader bearish structure remains a significant risk.
There's also something important to understand about the projection.
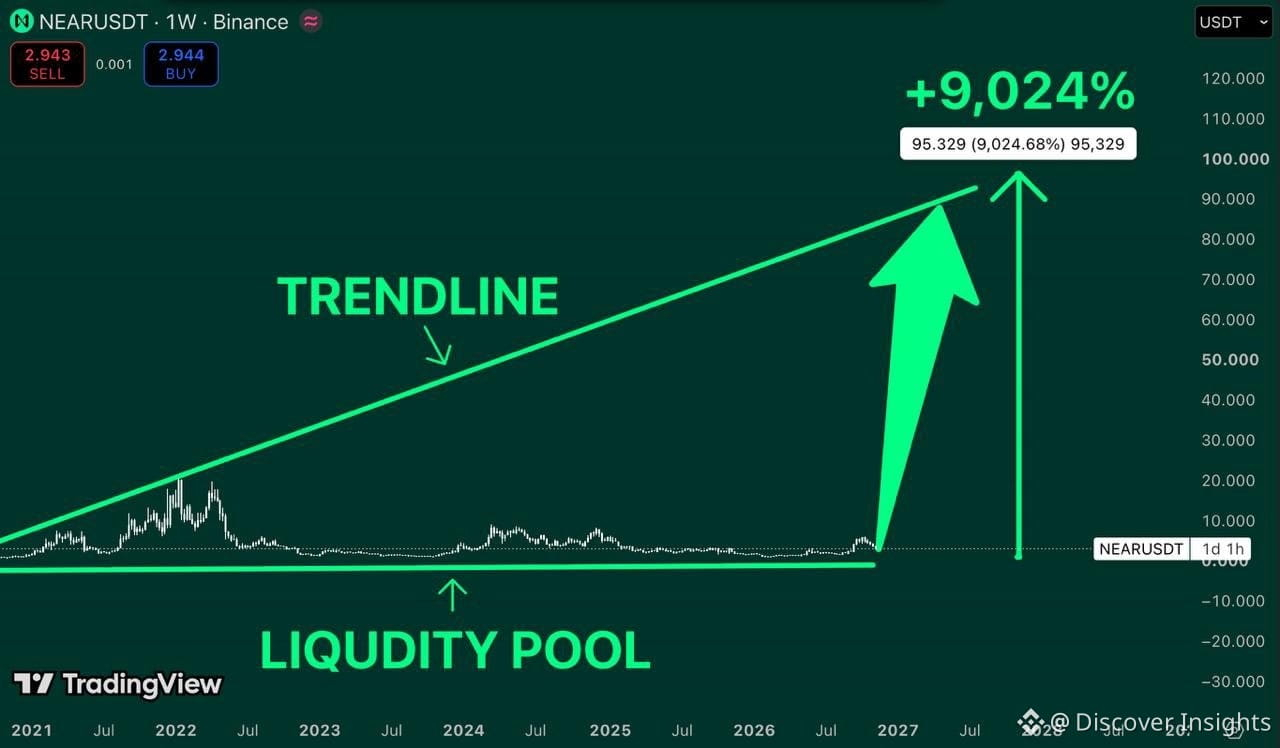
The 9,024% measurement is calculated from the chart's marked historical base, not the current $2.94 price.
And reaching $90–100 would require extraordinary market conditions, sustained demand, and a massive expansion in market capitalization.
But think about the market psychology.
In 2022, traders were chasing NEAR above $20.
In 2024, excitement returned as price approached $9.
Now it's trading below $3.
The excitement has faded.
Momentum has weakened.
And price is sitting near a region that has repeatedly attracted buyers throughout its history.
That doesn't automatically mean the bottom is in.
But if buyers successfully defend this long-term liquidity zone and begin breaking the sequence of lower highs, the next expansion could become significant.
The $90–100 projection is extremely speculative, not a guaranteed outcome.
I'm not blindly expecting a 90x rally.
I'm watching whether this multi-year consolidation structure can finally transition into a sustained bullish trend.
Because the biggest market expansions don't begin with everyone agreeing that prices will go higher.
They begin when the market structure starts changing, and buyers gradually regain control.
And $NEAR is definitely a chart worth watching.
#USPPIMissMayEaseBTCPressure
$NEAR
and establish a clear sequence of higher lows.
A sustained weekly reclaim of $5 would be the first encouraging signal.
Breaking above $7–10 with expanding volume would strengthen the bullish thesis considerably.
And a decisive move above $20 would represent a major structural shift, potentially opening the door to price discovery.
Without those confirmations, the broader bearish structure remains a significant risk.
There's also something important to understand about the projection.
The 9,024% measurement is calculated from the chart's marked historical base, not the current $2.94 price.
And reaching $90–100 would require extraordinary market conditions, sustained demand, and a massive expansion in market capitalization.
But think about the market psychology.
In 2022, traders were chasing NEAR above $20.
In 2024, excitement returned as price approached $9.
Now it's trading below $3.
The excitement has faded.
Momentum has weakened.
And price is sitting near a region that has repeatedly attracted buyers throughout its history.
That doesn't automatically mean the bottom is in.
But if buyers successfully defend this long-term liquidity zone and begin breaking the sequence of lower highs, the next expansion could become significant.
The $90–100 projection is extremely speculative, not a guaranteed outcome.
I'm not blindly expecting a 90x rally.
I'm watching whether this multi-year consolidation structure can finally transition into a sustained bullish trend.
Because the biggest market expansions don't begin with everyone agreeing that prices will go higher.
They begin when the market structure starts changing, and buyers gradually regain control.
And $NEAR is definitely a chart worth watching.
#USPPIMissMayEaseBTCPressure
$NEAR