Ever jumped into a trade relying on just one chart signal?
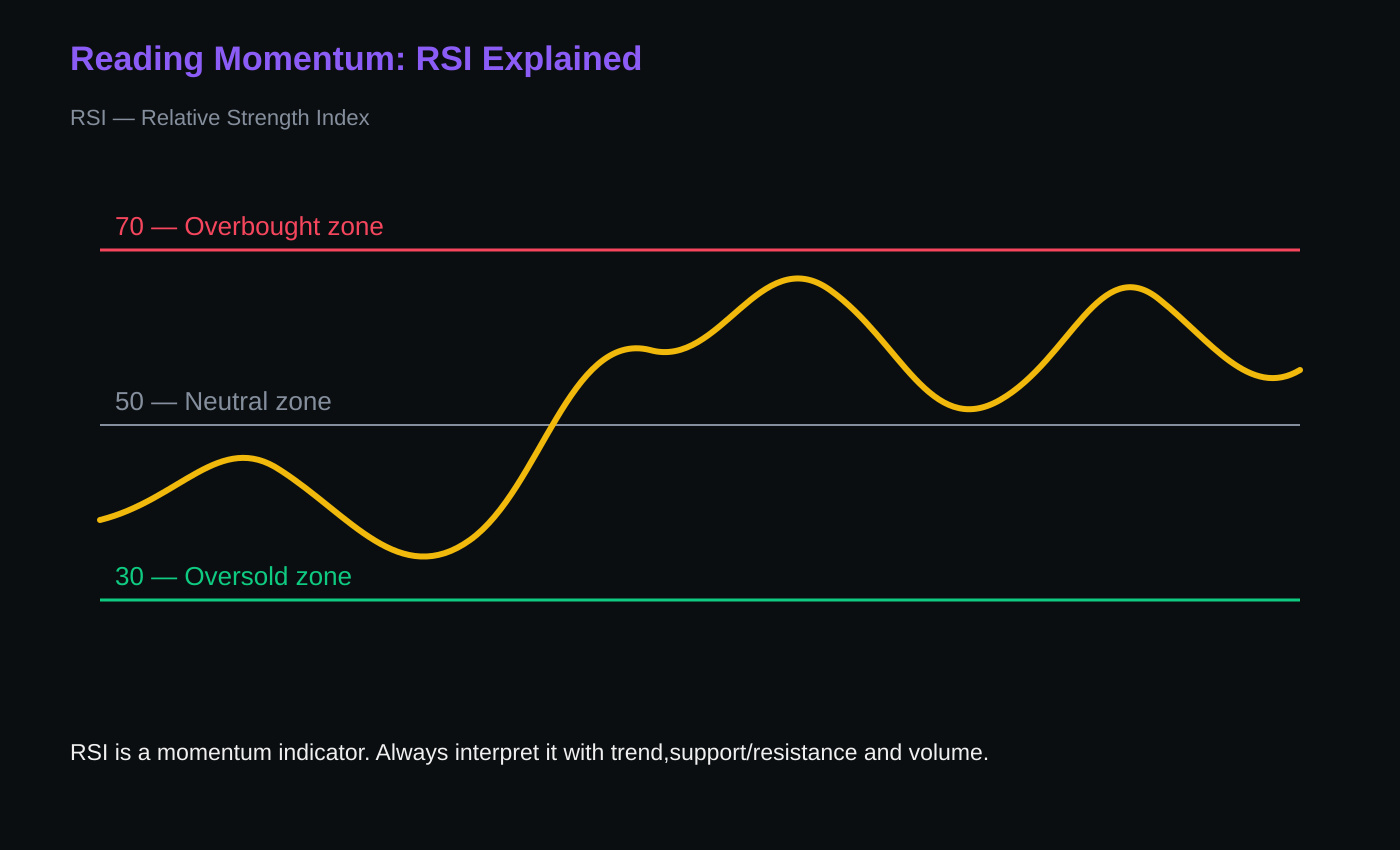
The Relative Strength Index (RSI) measures momentum on a 0-100 scale, helping you gauge market dynamics:
⚡ Above 70 typically signals strong or potentially overextended momentum.
⚖️ Around 50 indicates balanced momentum.
📉 Below 30 typically signals weak or potentially oversold momentum.
A single reading rarely tells the whole story. RSI should always be combined with price structure, volume, and trend for confirmation — not used alone.
The best trading decisions happen when your indicator aligns with broader market context.
#CryptoTrading #BinanceSquare #TechnicalAnalysis #RSI
The Relative Strength Index (RSI) measures momentum on a 0-100 scale, helping you gauge market dynamics:
⚡ Above 70 typically signals strong or potentially overextended momentum.
⚖️ Around 50 indicates balanced momentum.
📉 Below 30 typically signals weak or potentially oversold momentum.
A single reading rarely tells the whole story. RSI should always be combined with price structure, volume, and trend for confirmation — not used alone.
The best trading decisions happen when your indicator aligns with broader market context.
#CryptoTrading #BinanceSquare #TechnicalAnalysis #RSI