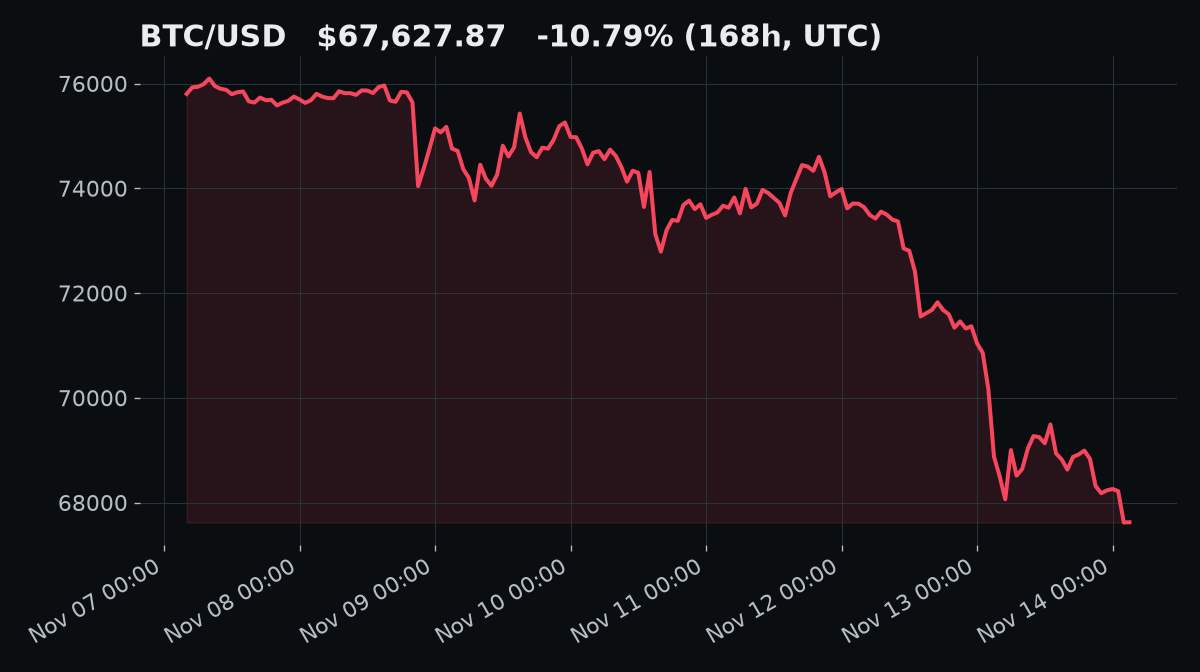
Bitcoin is sitting right on its 200-week average, and the weekly close is Sunday.
The chart: $BTC is $67,627.87, down 10.79% over 7 days. CoinDesk puts the 200-week moving average near $68,000, and price slipped under it on Friday, touching $67,652 (CoinDesk, Nov 13).
Why Sunday matters: the weekly MACD histogram has dipped below zero. If it stays negative at the weekly close, the bearish signal is confirmed. Since 2012 that signal has fired 24 times, and in 13 of them BTC fell at least 16% afterward. 11 times it fell less, including 3% in June (CoinDesk analysis).
What would flip the view: a weekly close back above the 200-week line with ETF outflows cooling. Right now the dollar index is above 103 and the 10-year yield is 5.125%, which is a headwind for risk assets.
Does a weekly close under the 200-week line change how you read this? Not financial advice.
Disclosure: I can earn Binance Write to Earn rewards from this post.
#Bitcoin #BTC #CryptoMarket
The chart: $BTC is $67,627.87, down 10.79% over 7 days. CoinDesk puts the 200-week moving average near $68,000, and price slipped under it on Friday, touching $67,652 (CoinDesk, Nov 13).
Why Sunday matters: the weekly MACD histogram has dipped below zero. If it stays negative at the weekly close, the bearish signal is confirmed. Since 2012 that signal has fired 24 times, and in 13 of them BTC fell at least 16% afterward. 11 times it fell less, including 3% in June (CoinDesk analysis).
What would flip the view: a weekly close back above the 200-week line with ETF outflows cooling. Right now the dollar index is above 103 and the 10-year yield is 5.125%, which is a headwind for risk assets.
Does a weekly close under the 200-week line change how you read this? Not financial advice.
Disclosure: I can earn Binance Write to Earn rewards from this post.
#Bitcoin #BTC #CryptoMarket