

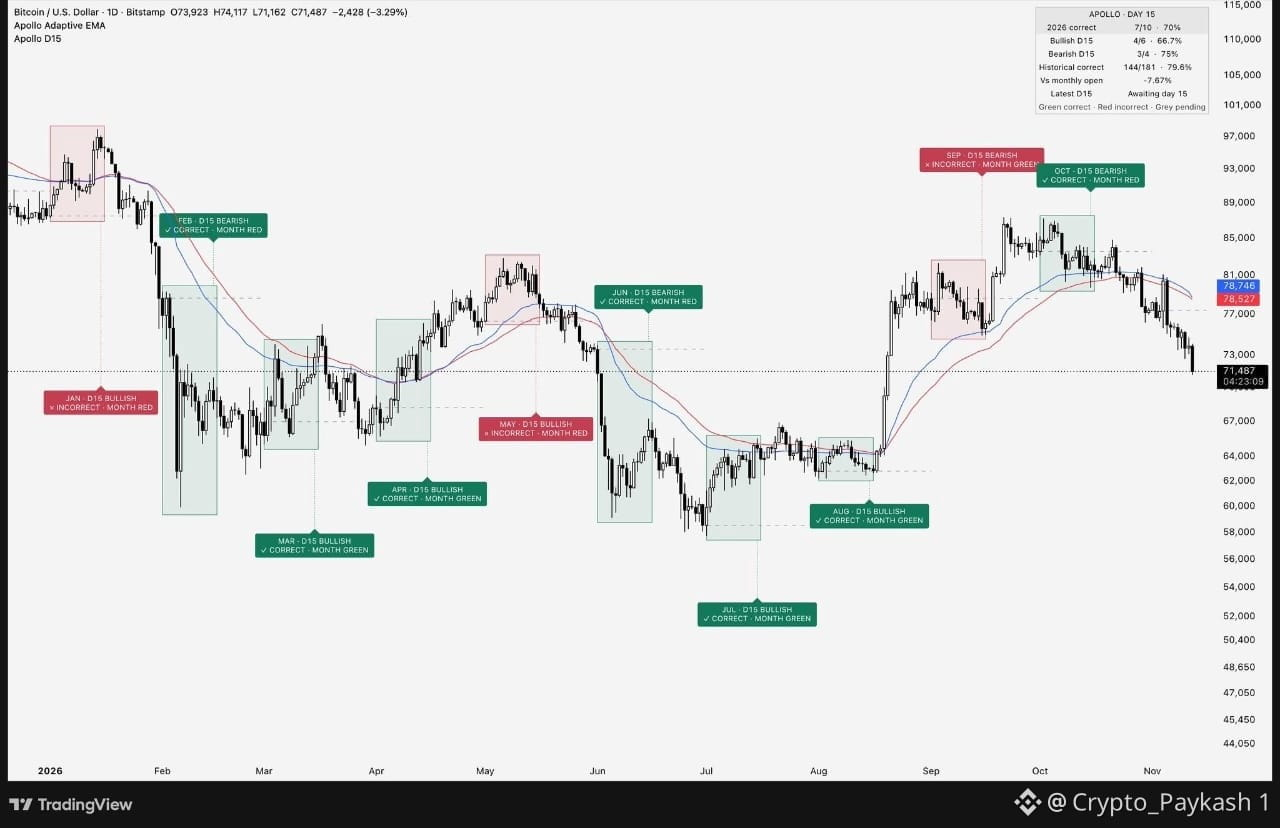
With the 15th of the month approaching, I've been paying attention to a Bitcoin pattern that has historically been worth watching. Where $BTC closes on the 15th compared with its monthly open has often given a useful indication of how the rest of the month could play out. When Bitcoin is above the monthly open on the 15th, the month has generally ended green. When it's below, the month has more often closed red. Of the 10 completed months this year, seven have followed this pattern, giving it a 70% hit rate. Looking at the longer-term data, 144 out of 181 months have followed the same direction, which works out to approximately 79.6%. That's a pretty interesting historical pattern, although it doesn't guarantee the same outcome every month. Right now, Bitcoin is trading below its monthly open, which is around $77K. If it remains below that level at the November 15 close, the historical pattern points towards another red month for Bitcoin. #BTC Price Analysis# #Macro Insights#
انضم إلى مُستخدمي العملات الرقمية حول العالم على Binance Square
⚡️ احصل على أحدث المعلومات المفيدة عن العملات الرقمية.
💬 موثوقة من قبل أكبر منصّة لتداول العملات الرقمية في العالم.
👍 اكتشف الرؤى الحقيقية من صنّاع المُحتوى الموثوقين.
البريد الإلكتروني / رقم الهاتف