
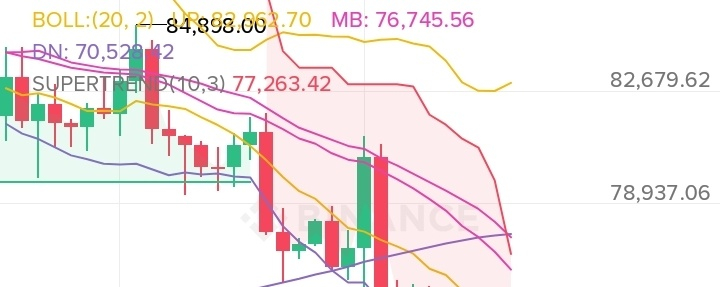

Based on your 1D chart, Bitcoin is showing strong selling pressure. BTC is trading around $68,989, down approximately 6.59%.
🔻 Technical Analysis
Trend: Bearish — price is trading below MA(7), MA(25), and MA(99).
Momentum: Strong downside momentum with a large bearish candle.
Bollinger Bands: Price has moved below the lower band, indicating strong selling pressure and a possibility of a short-term relief bounce.
Volume: Selling activity has increased, confirming bearish momentum.
🎯 Important Price Levels
Level Price
Immediate Support $68,500
Next Support $67,700
Resistance 1 $70,500
Resistance 2 $71,500
Major Resistance $73,500
📉 Trading Strategy
Bearish Scenario:
If BTC breaks below $68,500 and confirms the breakdown, further downside toward $67,700 becomes possible.
Bullish Scenario:
If buyers defend $68,500 and reclaim $70,500, a recovery toward $71,500 could follow.
My Trading View
C, I would avoid chasing a short position after such a large bearish candle. Wait for a retest and confirmation before entering.
Overall Bias: Bearish until BTC reclaims $70,500–$71,500.
#BTC/USDT