
🚨 NVDAB/USDT (4H) Market Update: Bearish Pressure Meets Key Demand Zone
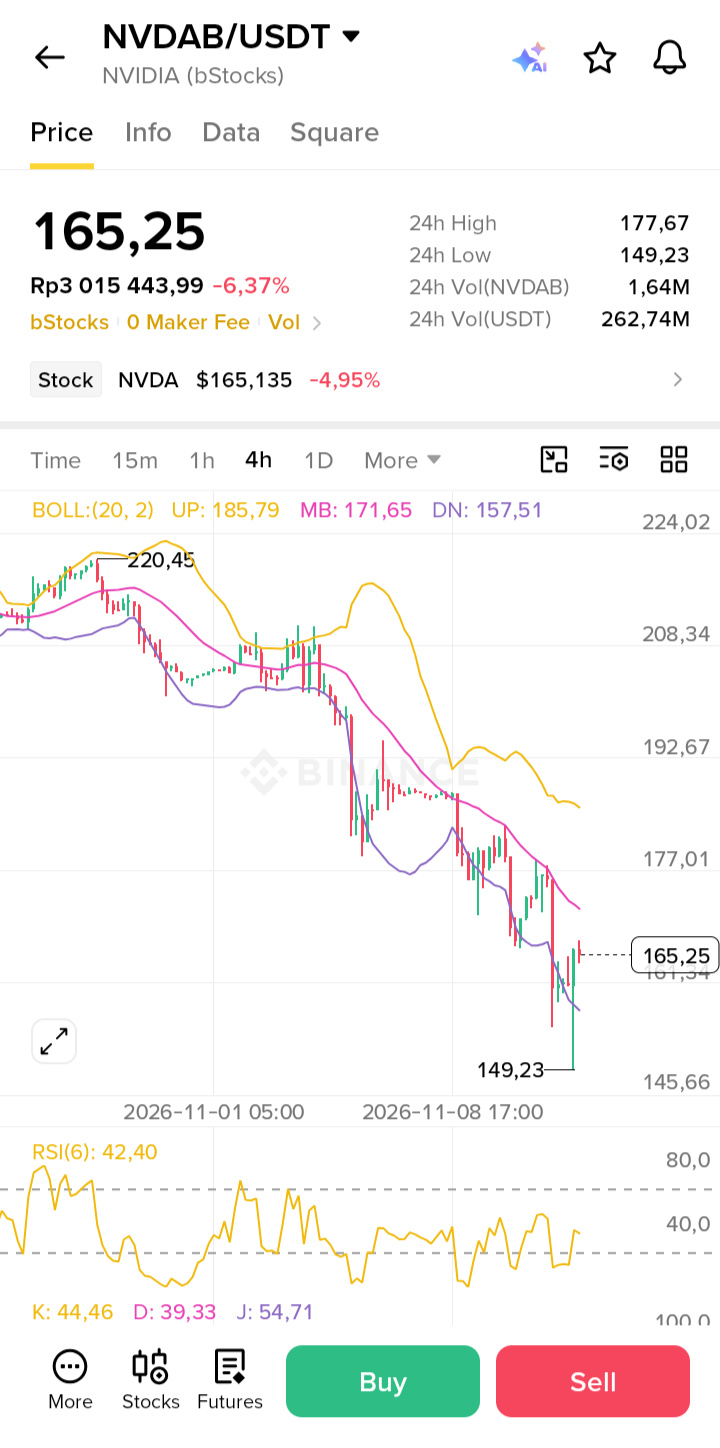
NVIDIA tokenized stock (NVDAB) is currently trading around $165.25 (-6.37% over the last 24 hours), experiencing sharp volatility after a sustained multi-day downtrend from its recent swing high of $220.45.
📊 Technical Analysis (4-Hour Timeframe)
Trend & Market Structure: The 4H chart shows a clear bearish structure characterized by lower highs and lower lows. However, after sweeping liquidity down to the 24h low of $149.23, buyers stepped in aggressively, printing strong bullish recovery candles back above the $165.00 mark.
Bollinger Bands (20, 2): Price recently pierced below the lower Bollinger Band (DN: $157.51), signaling short-term oversold exhaustion. It has now reclaimed the lower band and is heading toward the middle band (MB: $171.65), which acts as immediate dynamic resistance. The upper band sits higher at $185.79.
Momentum Indicators (RSI & KDJ):
RSI (6) is recovering from oversold territory, currently sitting at 42.40—leaving plenty of room for an upside relief bounce before hitting overbought levels.
KDJ shows a fresh bullish crossover (K: 44.46, D: 39.33, J: 54.71), supporting short-term upward momentum.
🔑 Key Levels to Watch
Immediate Resistance: $171.65 (Bollinger Middle Band), followed by $177.67 (24h High). A clean 4H candle close above $171.65 could open the door for a broader relief rally.
Key Support: $157.51 (Lower Bollinger Band) and the major structural floor at $149.23. Holding above $157.50 keeps the short-term recovery intact.
🌐 Fundamental & Macro Outlook
Tech Sector Rotation & Risk Sentiment: Tokenized equities like NVDAB closely track traditional Wall Street sentiment around AI hardware demand and semiconductor valuations. Recent pullbacks across high-beta tech stocks reflect broader macroeconomic caution and profit-taking ahead of key US economic data releases and earnings catalysts.
Liquidity & Volume: With $262.74M in 24h USDT volume, market participation remains elevated, confirming that institutional and retail traders are actively defending the $150 psychological zone.
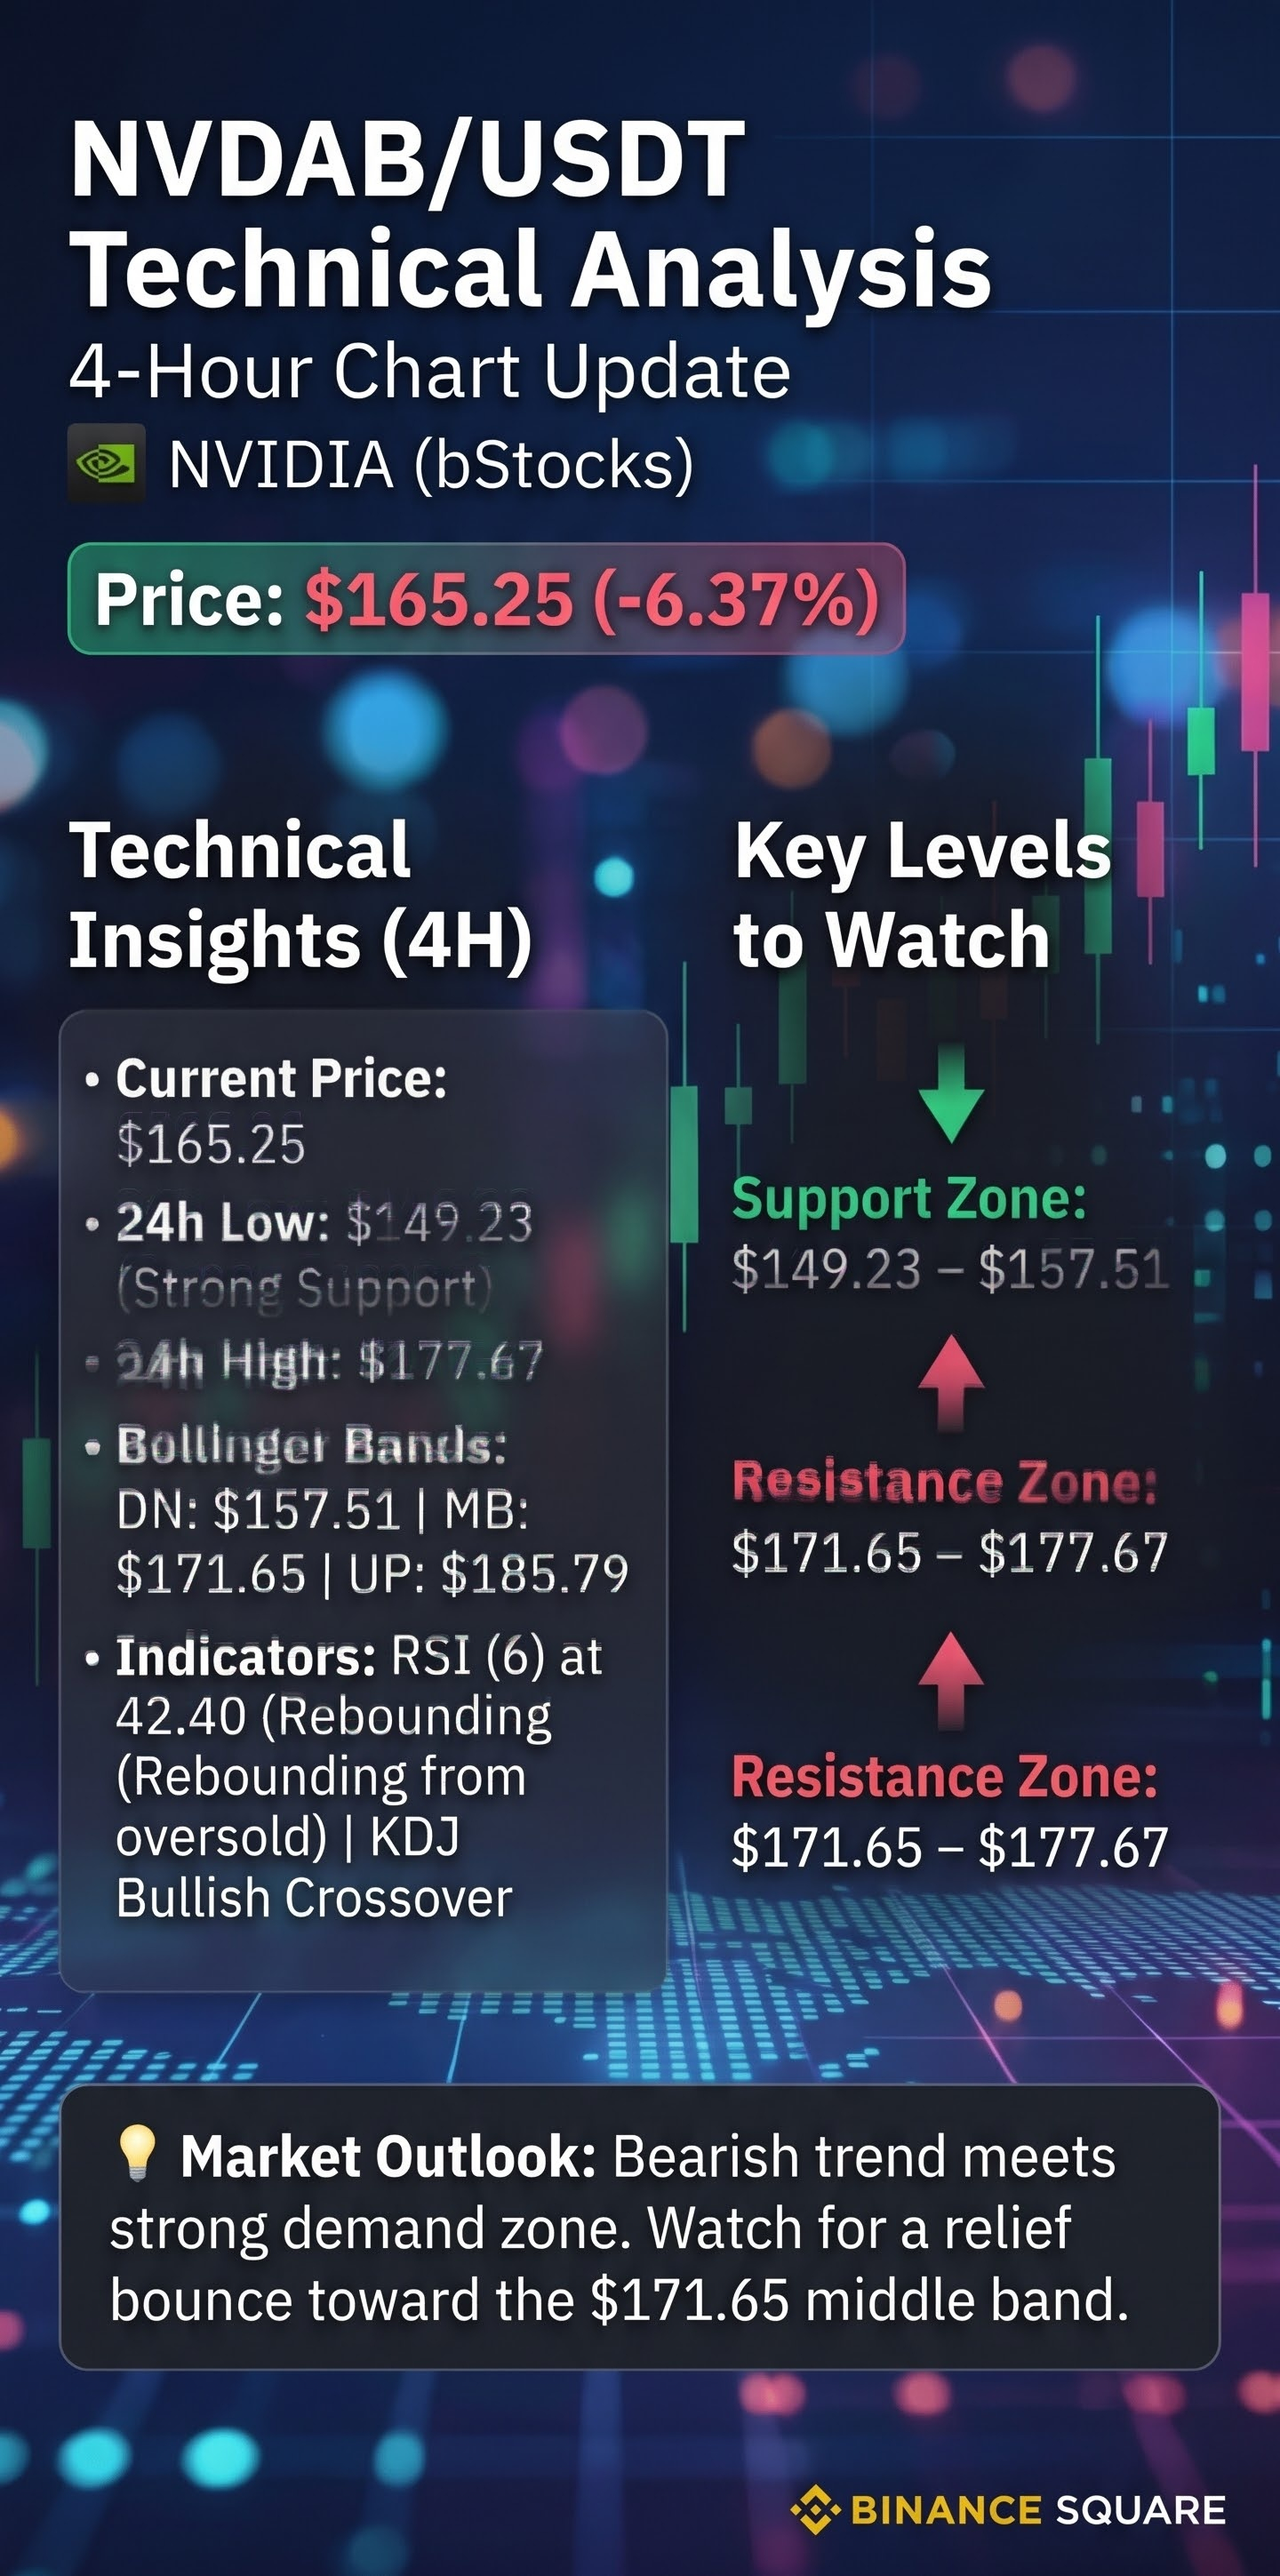
💡 Trading Takeaway: While the broader 4H trend remains bearish, the sharp rejection from $149.23 alongside recovering RSI and KDJ indicators points toward a potential short-term relief bounce. Watch how price reacts at the $171.65 resistance level before looking for trend continuation.
Disclaimer: This content is for informational purposes only and does not constitute financial advice. Always manage your risk and DYOR.