


MAGMA is gaining serious attention after climbing approximately 12% in 24 hours, with trading volume reaching around $56.28 million.
But here's the interesting part: the rally is not showing the same strength across every timeframe.
The 15-minute and 1-hour charts show a bullish structure, while the 4-hour and daily charts reveal important resistance levels that traders should not ignore.
Let's break it down.
1. Short-Term Momentum: 15M
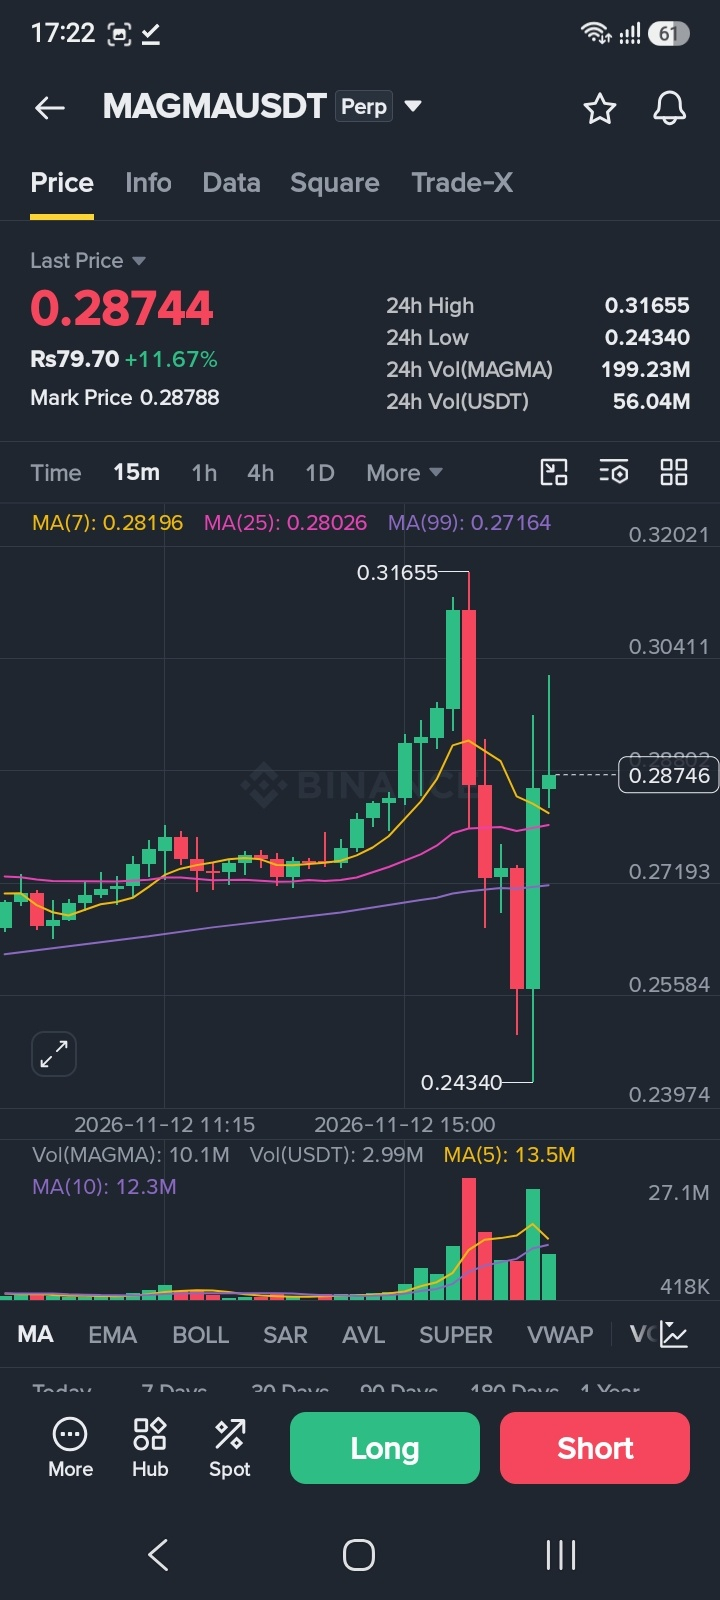
MAGMA is trading around $0.287, above all three moving averages:
MA7: $0.28196
MA25: $0.28026
MA99: $0.27164
This is a positive short-term structure.
However, the latest candle volume is approximately 10.1M, below MA5 at 13.5M and MA10 at 12.3M. Momentum is positive, but immediate volume confirmation is still needed.
2. One-Hour Trend: Buyers Have the Advantage
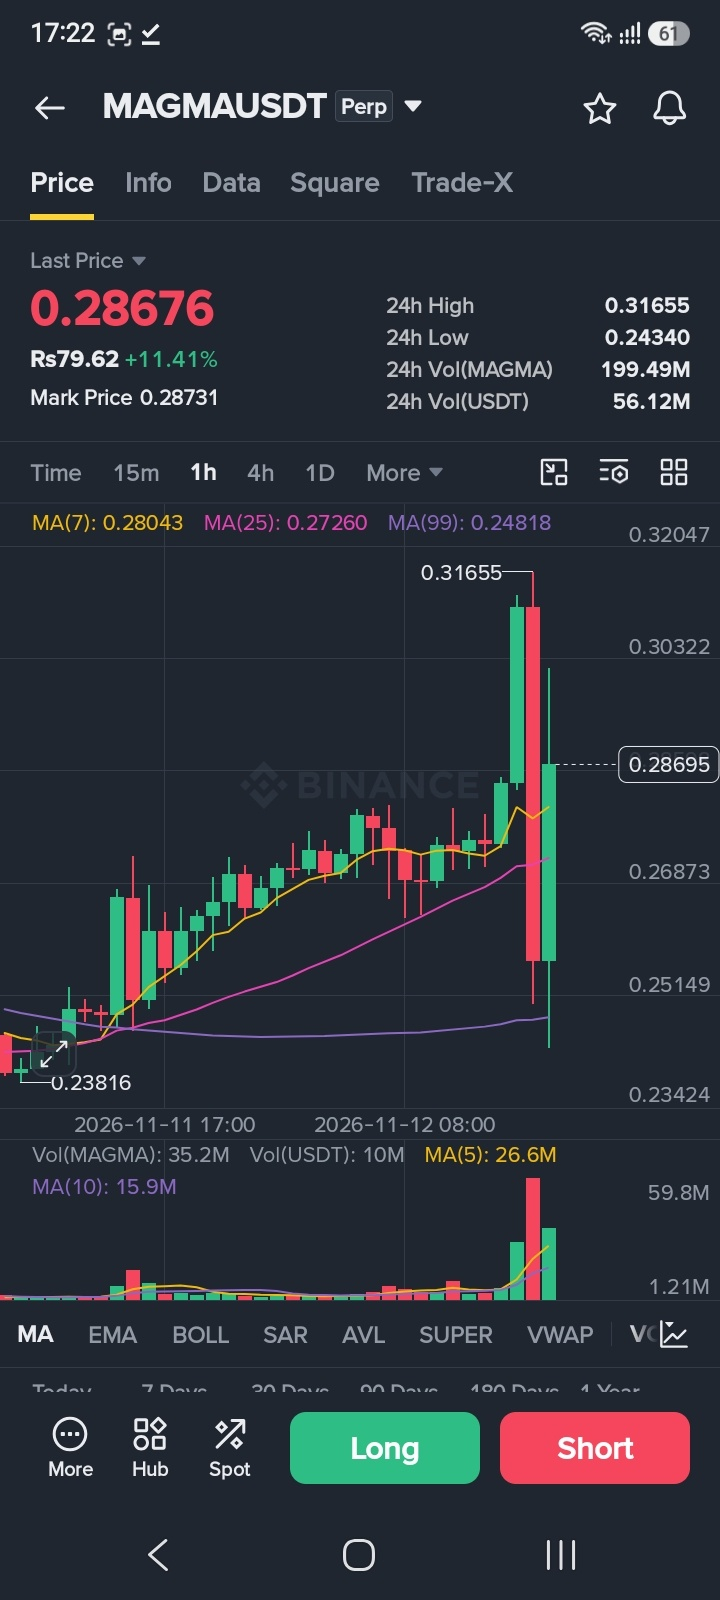
The 1H chart looks stronger:
MA7: $0.28043
MA25: $0.27260
MA99: $0.24818
Price is above all three averages.
Volume is approximately 35.2M, above MA5 at 26.6M and MA10 at 15.9M. This suggests stronger participation behind the recent move.
3. Four-Hour Structure: Recovery Meets Resistance
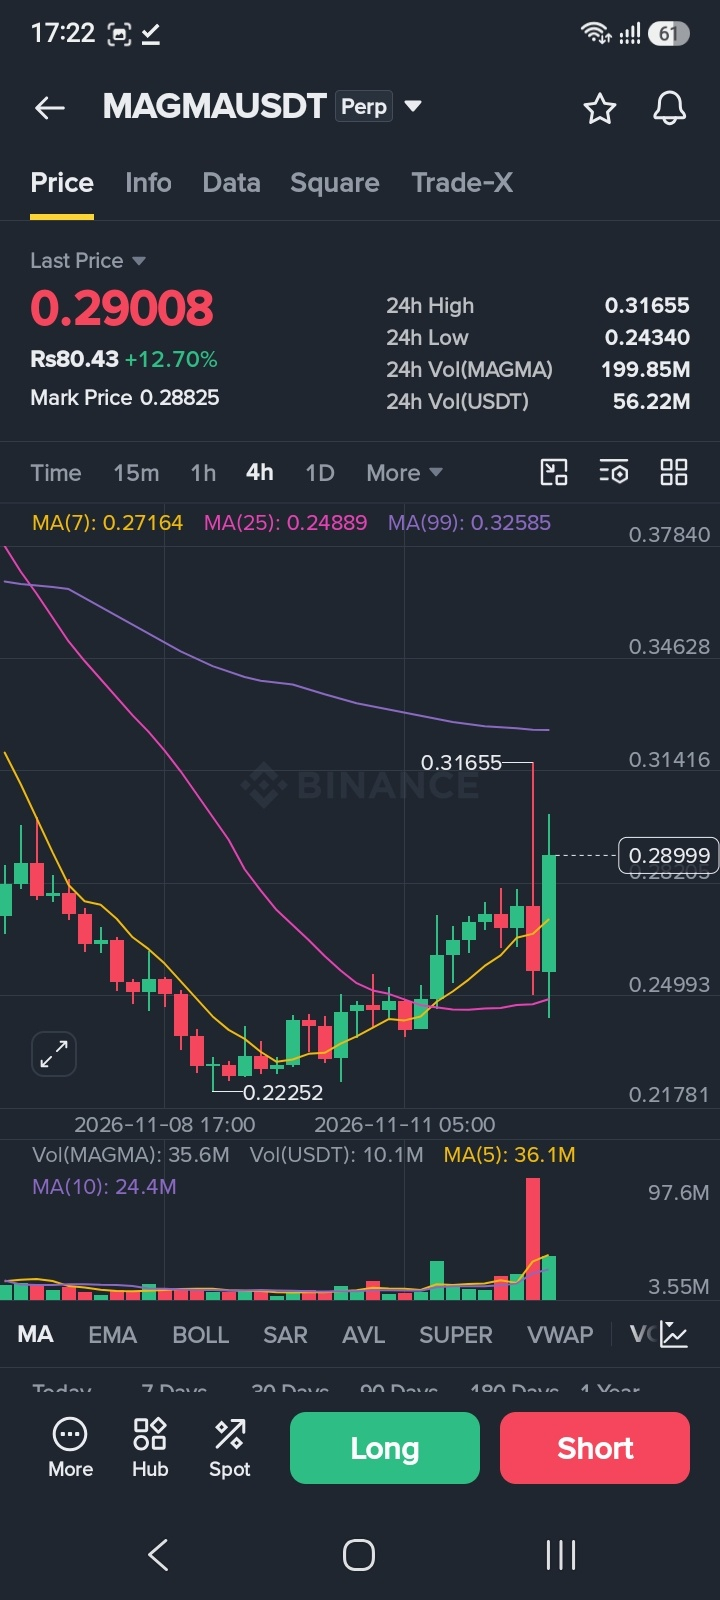
The 4H chart shows a meaningful recovery:
MA7: $0.27164
MA25: $0.24889
MA99: $0.32585
Price is above MA7 and MA25, but remains below MA99.
Volume is around 35.6M, slightly below MA5 at 36.1M but above MA10 at 24.4M.
The recovery is encouraging, but the MA99 remains a major technical hurdle.
4. Daily Chart: The Bigger Challenge
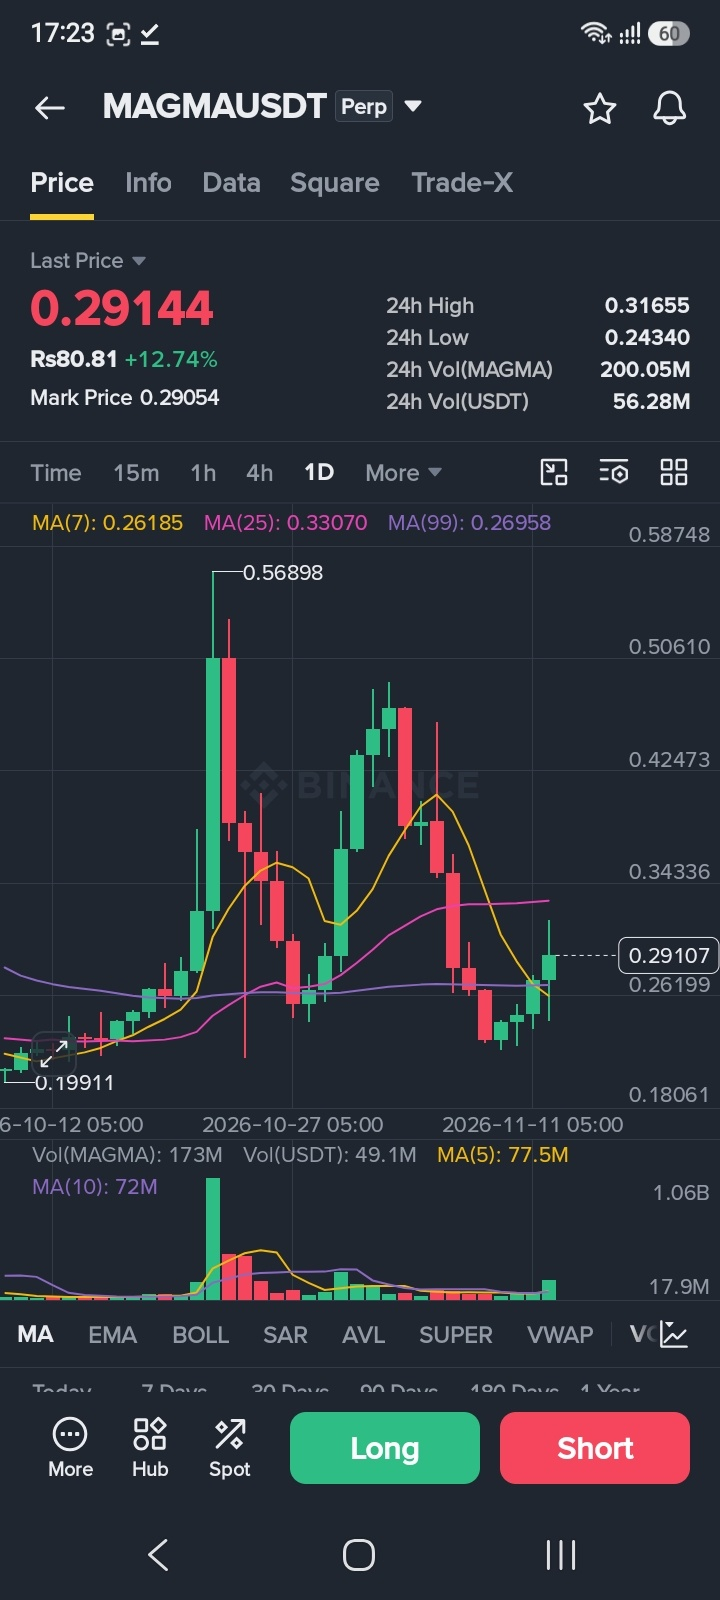
The daily chart presents a mixed picture:
MA7: $0.26185
MA25: $0.33070
MA99: $0.26958
Price is above MA7 and MA99, but still below MA25.
Daily volume is approximately 173M, compared with MA5 at 77.5M and MA10 at 72M.
That elevated activity makes this rally worth watching, although it does not guarantee a sustained reversal.
Key MAGMA Price Levels
Resistance levels:
$0.31655 — recent 24H high
$0.32585 — 4H MA99
$0.33070 — Daily MA25
$0.34600–$0.37840 — higher resistance zone
Support levels:
$0.28000–$0.27200 — immediate support area
$0.26900–$0.26100 — next important support zone
$0.24340 — recent 24H low
What Could Happen Next?
Bullish scenario: If MAGMA holds its short-term support and breaks above $0.31655 with convincing volume, attention may shift toward the $0.32585–$0.33070 resistance zone.
Bearish scenario: If buyers fail to defend the $0.280–$0.272 area, a pullback toward the $0.269–$0.261 zone becomes possible.
Final Take
MAGMA has delivered an impressive rally, and its 15M and 1H structures currently favor buyers.
However, the bigger trend still faces resistance on the 4H and daily charts.
The next important question is simple:
Can MAGMA turn $0.31655 into support, or will sellers defend the resistance zone?
What do you think — is MAGMA preparing for another leg up, or does it need a healthy correction first?

Share your view below.
Disclaimer: This article is for educational purposes only and is not financial advice. Technical observations are based on the chart data provided. Cryptocurrency markets are volatile, and no price movement or breakout is guaranteed.
#MAGMA #MAGMAUSDT #BinanceSquare #BinancePick #CryptoAnalysis #Altcoins #TechnicalAnalysis #CryptoMarket