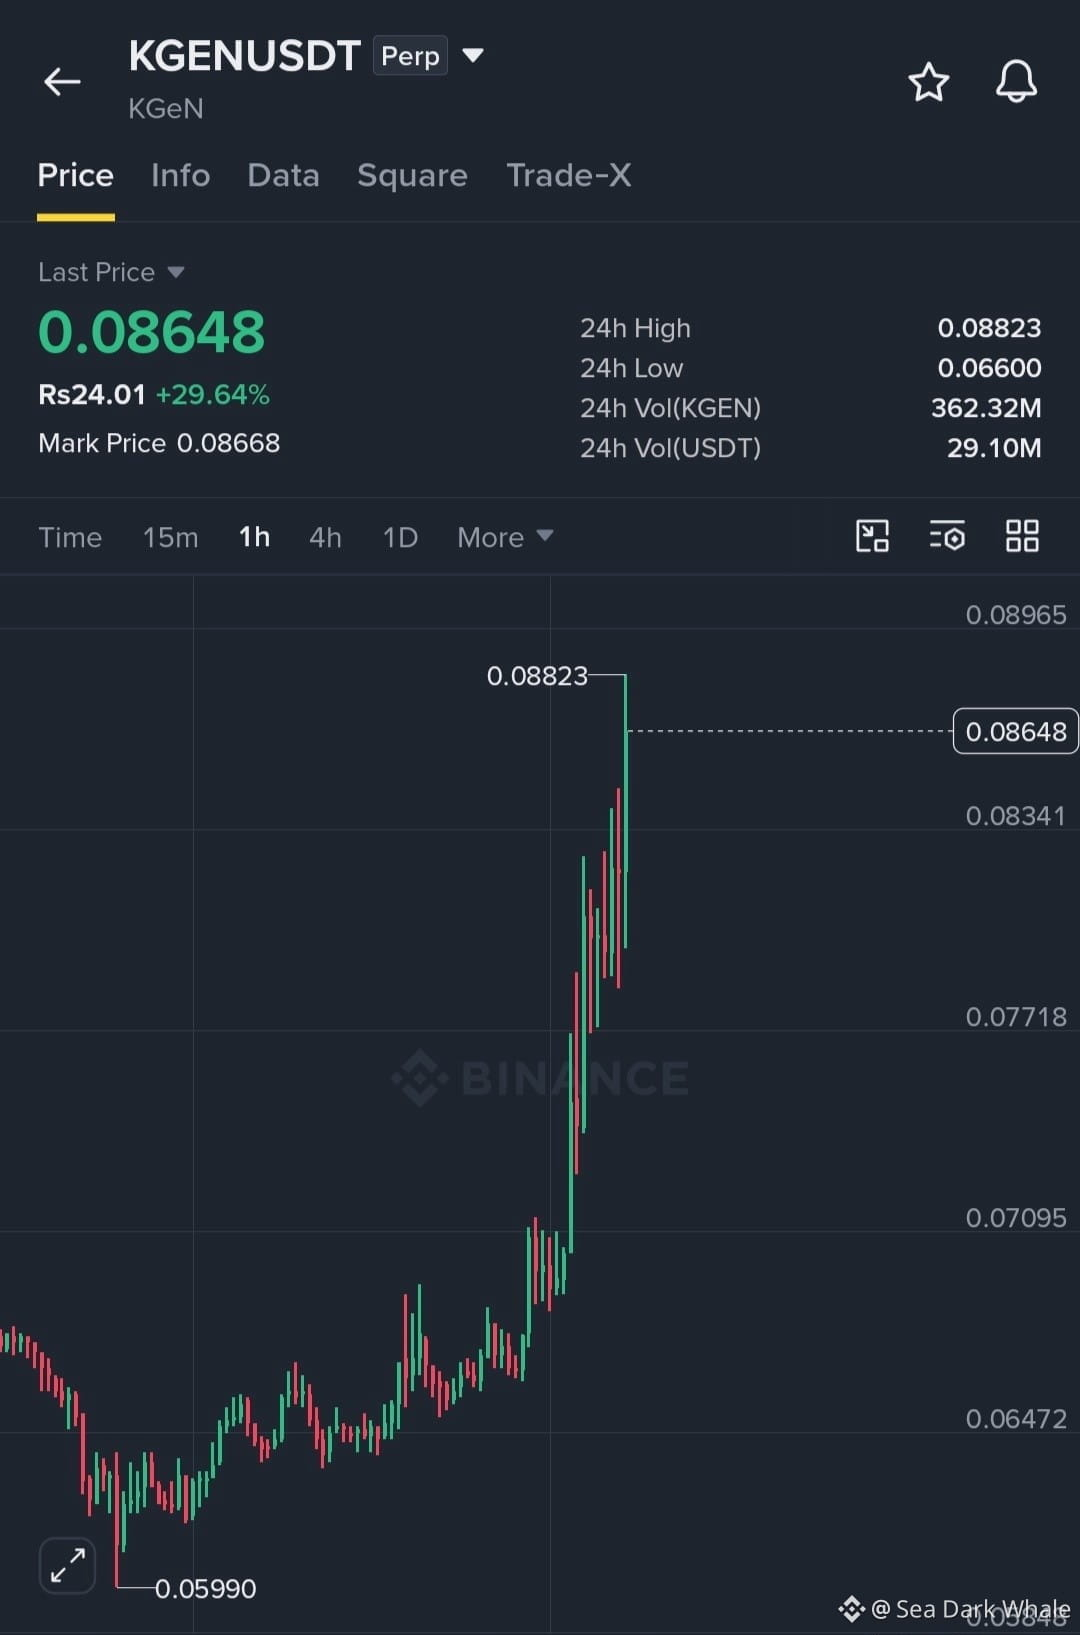
KGEN breaks out — up nearly 30% and knocking on 0.08823. $KGEN
What a comeback. KGEN has surged nearly 30%, pushing through key resistance levels and climbing toward 0.08823. The 1h chart tells the same story: a steady climb from near 0.05990, then a sharp vertical run to the 0.08823 high.
The structure still favours the buyers. They are printing higher highs and higher lows, and that momentum has not faded yet.
The numbers behind the move: last price 0.08648, mark price 0.08668, up 29.64% over 24 hours. The 24h range runs from 0.06600 to 0.08823, with 362.32M KGEN (29.10M USDT) changing hands in a day.
Two levels decide what happens next. A clean breakout above 0.08823 could open the door toward 0.090–0.095. On the downside, 0.080 is the support area to watch.
Massive recovery, strong breakout, and the bulls are still pushing. The rally may not be over yet — but the breakout needs to actually clear 0.08823 first.
Are you watching 0.08823 for the breakout, or waiting for a pullback to 0.080?
Personal market analysis only. NFA — manage risk and DYOR. Educational content, not investment advice or a recommendation to buy, sell, deposit, or withdraw any asset. No paid promotion or referral/affiliate links.
What a comeback. KGEN has surged nearly 30%, pushing through key resistance levels and climbing toward 0.08823. The 1h chart tells the same story: a steady climb from near 0.05990, then a sharp vertical run to the 0.08823 high.
The structure still favours the buyers. They are printing higher highs and higher lows, and that momentum has not faded yet.
The numbers behind the move: last price 0.08648, mark price 0.08668, up 29.64% over 24 hours. The 24h range runs from 0.06600 to 0.08823, with 362.32M KGEN (29.10M USDT) changing hands in a day.
Two levels decide what happens next. A clean breakout above 0.08823 could open the door toward 0.090–0.095. On the downside, 0.080 is the support area to watch.
Massive recovery, strong breakout, and the bulls are still pushing. The rally may not be over yet — but the breakout needs to actually clear 0.08823 first.
Are you watching 0.08823 for the breakout, or waiting for a pullback to 0.080?
Personal market analysis only. NFA — manage risk and DYOR. Educational content, not investment advice or a recommendation to buy, sell, deposit, or withdraw any asset. No paid promotion or referral/affiliate links.