


$BTC /USD Complete Analysis — 12 November 2026
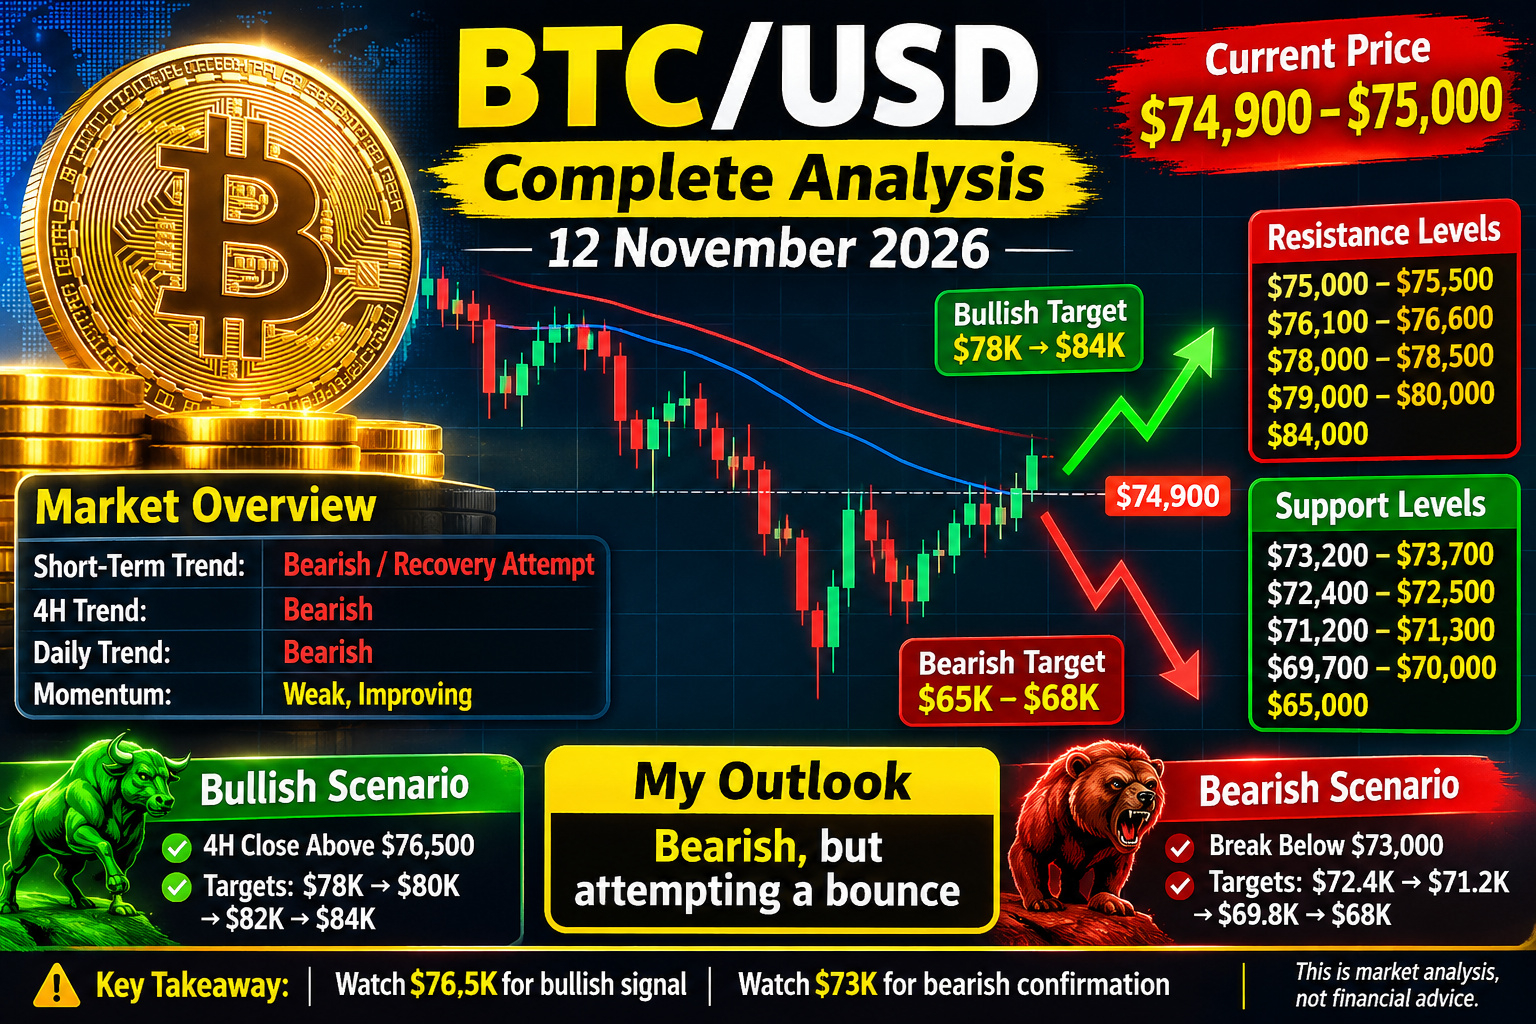
Current price: approximately $74,900–$75,000. $BTC has bounced from the ~$73.2K area, but remains about 7% lower over the past week, so the broader short-term structure is still under pressure.

Short-term trend: 🔴 Bearish / recovery attempt
4H trend: Bearish
Daily trend: Bearish
Momentum: Weak, but improving from oversold conditions
Key psychological level: $75,000
$BTC is still trading below important moving-average resistance. Recent technical data put the 200-session average around $78.2K, while the 20- and 50-period averages were around $77.7K and $79.1K, respectively.
🔑 Important Support Levels
Support Importance
$73,200–$73,700 Immediate support
$72,400–$72,500 Strong short-term support
$71,200–$71,300 Major support
$69,700–$70,000 Critical psychological zone
$65,000 Major bearish target if $70K breaks
The $73K–$75K region is currently particularly important because BTC recently reached its lowest level since August.
🚧 Resistance Levels
$75,000–$75,500: Immediate resistance
$76,100–$76,600: Strong resistance
$78,000–$78,500: Major resistance / 200-day area
$79,000–$80,000: Major breakout zone
$84,000: Larger trend-reversal confirmation area
A move above $76.5K would materially improve the short-term structure. Above $78K–$80K, the probability of a larger recovery increases.
📈 Bullish Scenario
If BTC can achieve a 4H/daily close above $76,500, I would watch:
$78,000 → $80,000 → $82,000 → $84,000
A sustained move above $80K would be much more convincing than a simple intraday spike.
📉 Bearish Scenario
If BTC loses $73,000, downside could accelerate toward:
$72,400 → $71,200 → $69,800 → $68,000
A decisive daily close below $70K would make the $65K–$68K region increasingly relevant. Recent market analysis has specifically put $65K back in focus after five consecutive weeks of selling.
📰 Fundamental/Macro Picture
The biggest current problem for BTC is institutional outflows + inflation/rate pressure. U.S. spot Bitcoin ETFs experienced roughly $968.5M of net outflows across November 4–9, while stronger-than-expected October CPI increased concerns about further Fed tightening.
At the same time, derivatives remain very active: BTC futures volume was recently around $44.5B, with approximately $51.6B open interest.
That means a breakout or breakdown can produce large, fast moves because leverage remains substantial.
🎯 My BTC/USD Outlook
Current bias: 🔴 Bearish, but attempting a relief bounce
- 🟢 Above $76.5K: bullish recovery signal
- 🟢 Above $80K: stronger trend reversal
- 🟡 $73K–$76.5K: high-volatility range
- 🔴 Below $73K: bearish continuation
- 🔴 Below $70K: significant downside risk
- 🎯 Bearish target: $65K–$68K
- 🎯 Bullish targets: $78K → $80K → $84K
Trading idea: I would avoid chasing BTC in the middle of the $73K–$76.5K range. The cleaner confirmation is either a break/retest above $76.5K for a long setup or a confirmed breakdown below $73K for a bearish setup.
This is market analysis, not financial advice. Crypto and leveraged trading can result in substantial losses.
#BTCanalysis #BTCUSDTAnalysis #BTC走势分析 #TrendingPredictions #viralmypost