$XPL
/ USDT – 4H Technical Outlook (Liquidity Mapping & POI Reaction Setup)
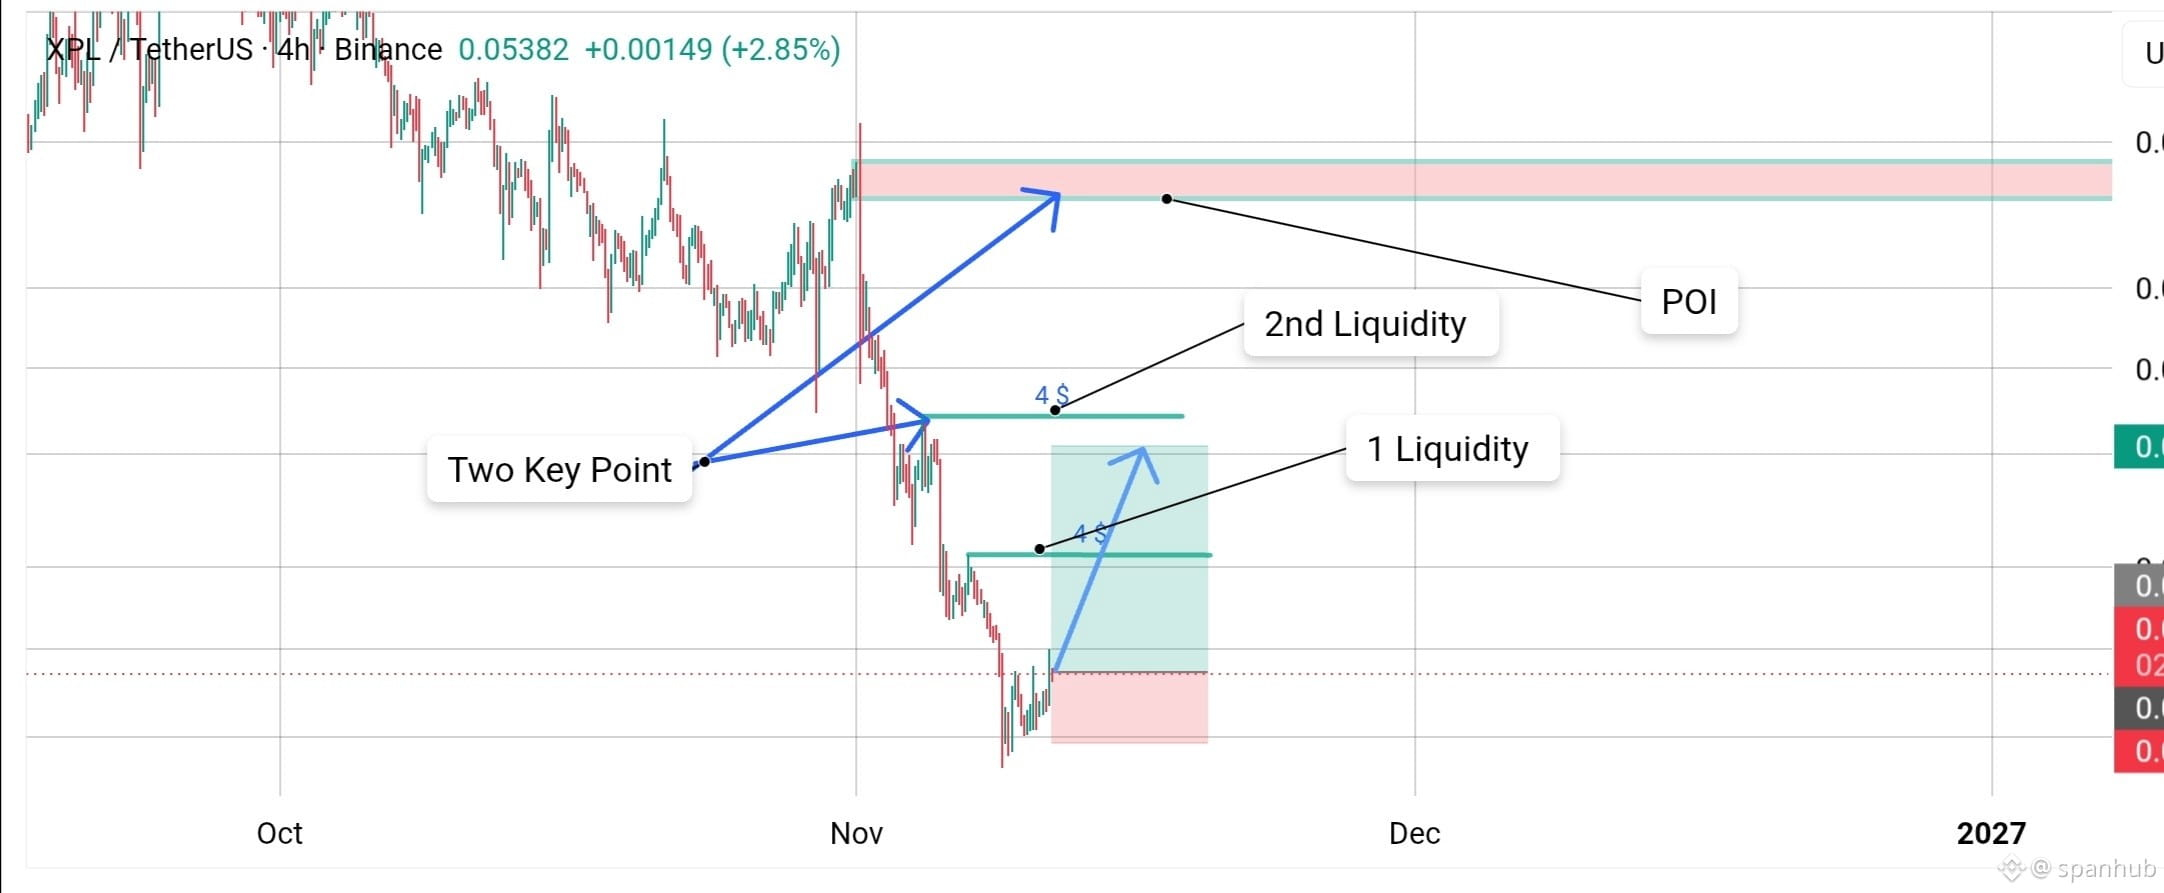
On the 4-hour chart, XPL is showing a positive reaction of +2.85%, currently trading around $0.05382 after sweeping local lows and testing primary liquidity structures.
📉 Technical Breakdown (4H Chart):
Current Price: ~$0.05382 (+2.85% on the session)
Structure: The chart highlights critical structural reference points, mapping out 1st Liquidity and 2nd Liquidity levels alongside two key breakout/retest paths. Price is currently reacting from support toward the primary overhead POI (Point of Interest) / Supply Zone.
Support Zone: Local demand base formed following the recent downside sweep, keeping the immediate relief structure active.
Overhead POI Zone: Major supply block mapped out at the top of the range, acting as the primary target for the ongoing recovery wave.
💡 Trade Plan & Strategy:
Scenario: Tracking the impulsive push from local liquidity toward the upper POI zone. Monitoring reactions at key resistance milestones to determine whether to take profits or look for short setups upon a touch of the major supply block.
Risk Management: Maintain strict stop-losses below the recent swing low invalidation level to protect capital against sudden trend reversals.
$AGT
$B2
💬 Are you tracking XPL's path toward the POI here, or waiting for a deeper structural confirmation? Let's discuss below! 👇
#XPL #XPLUSDT #BinanceSquare #CryptoTrading #TechnicalAnalysis #Altcoins
/ USDT – 4H Technical Outlook (Liquidity Mapping & POI Reaction Setup)
On the 4-hour chart, XPL is showing a positive reaction of +2.85%, currently trading around $0.05382 after sweeping local lows and testing primary liquidity structures.
📉 Technical Breakdown (4H Chart):
Current Price: ~$0.05382 (+2.85% on the session)
Structure: The chart highlights critical structural reference points, mapping out 1st Liquidity and 2nd Liquidity levels alongside two key breakout/retest paths. Price is currently reacting from support toward the primary overhead POI (Point of Interest) / Supply Zone.
Support Zone: Local demand base formed following the recent downside sweep, keeping the immediate relief structure active.
Overhead POI Zone: Major supply block mapped out at the top of the range, acting as the primary target for the ongoing recovery wave.
💡 Trade Plan & Strategy:
Scenario: Tracking the impulsive push from local liquidity toward the upper POI zone. Monitoring reactions at key resistance milestones to determine whether to take profits or look for short setups upon a touch of the major supply block.
Risk Management: Maintain strict stop-losses below the recent swing low invalidation level to protect capital against sudden trend reversals.
$AGT
$B2
💬 Are you tracking XPL's path toward the POI here, or waiting for a deeper structural confirmation? Let's discuss below! 👇
#XPL #XPLUSDT #BinanceSquare #CryptoTrading #TechnicalAnalysis #Altcoins