What does a 66% single-day collapse actually leave behind?
That’s the question hanging over $NFP right now — and the answer isn’t just “a lower price.” It’s a chart with almost no buyers left, and a structure that’s still bleeding.
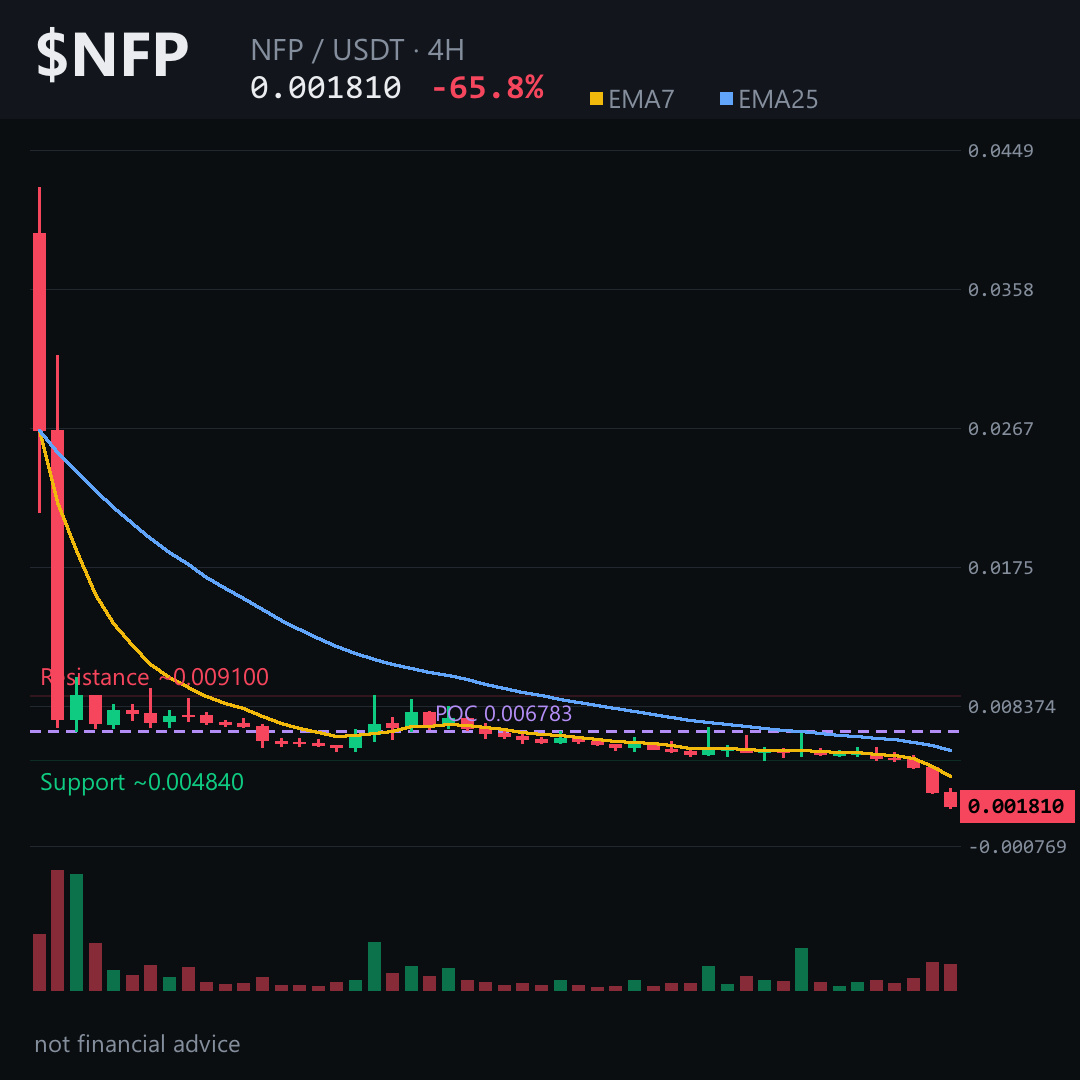
The 4-hour candles tell it plainly: eight red, four green. But the real damage came in two brutal waves — a 37% flush, then 34% right after. That’s not normal volatility. That’s a liquidation cascade with no bid stepping in.
Price is now near 0.00181. Moving averages are stacked far above, sloping down hard. RSI is pinned near 13 on the 4-hour — oversold is under 30. This isn’t sold; it’s been thrown away.
But oversold doesn’t mean bottom.
There’s an unfilled gap above, roughly 0.00445–0.00479. Gaps often act like magnets on a bounce. But any push toward it must first reclaim 0.00191 — and that’s the line that matters. As long as $NFP stays below that zone on the 4-hour, the path of least resistance still points lower.
The next natural floor sits near 0.00165, around the recent low. If that breaks, the weekly chart suggests 0.00114 could come into view — the next shelf where historic volume once traded.
My read: a falling knife with no futures market behind it. Open interest is effectively zero, funding flat — no leveraged longs getting squeezed. This is pure spot panic, not a rebound signal. An asset searching for a real buyer.
Tap $NFP to pull up the chart and trace these levels yourself — the gap above, the floor below, and the 0.00191 line separating them.
I’ll keep tracking whether that floor holds or folds — follow along so you don’t miss the next read.
Which zone are you watching more closely on NFP — the gap above or the floor below? 👇
⚠️ Not financial advice. DYOR.
#NFP #Crypto #Altcoins #BinanceSquare
That’s the question hanging over $NFP right now — and the answer isn’t just “a lower price.” It’s a chart with almost no buyers left, and a structure that’s still bleeding.
The 4-hour candles tell it plainly: eight red, four green. But the real damage came in two brutal waves — a 37% flush, then 34% right after. That’s not normal volatility. That’s a liquidation cascade with no bid stepping in.
Price is now near 0.00181. Moving averages are stacked far above, sloping down hard. RSI is pinned near 13 on the 4-hour — oversold is under 30. This isn’t sold; it’s been thrown away.
But oversold doesn’t mean bottom.
There’s an unfilled gap above, roughly 0.00445–0.00479. Gaps often act like magnets on a bounce. But any push toward it must first reclaim 0.00191 — and that’s the line that matters. As long as $NFP stays below that zone on the 4-hour, the path of least resistance still points lower.
The next natural floor sits near 0.00165, around the recent low. If that breaks, the weekly chart suggests 0.00114 could come into view — the next shelf where historic volume once traded.
My read: a falling knife with no futures market behind it. Open interest is effectively zero, funding flat — no leveraged longs getting squeezed. This is pure spot panic, not a rebound signal. An asset searching for a real buyer.
Tap $NFP to pull up the chart and trace these levels yourself — the gap above, the floor below, and the 0.00191 line separating them.
I’ll keep tracking whether that floor holds or folds — follow along so you don’t miss the next read.
Which zone are you watching more closely on NFP — the gap above or the floor below? 👇
⚠️ Not financial advice. DYOR.
#NFP #Crypto #Altcoins #BinanceSquare