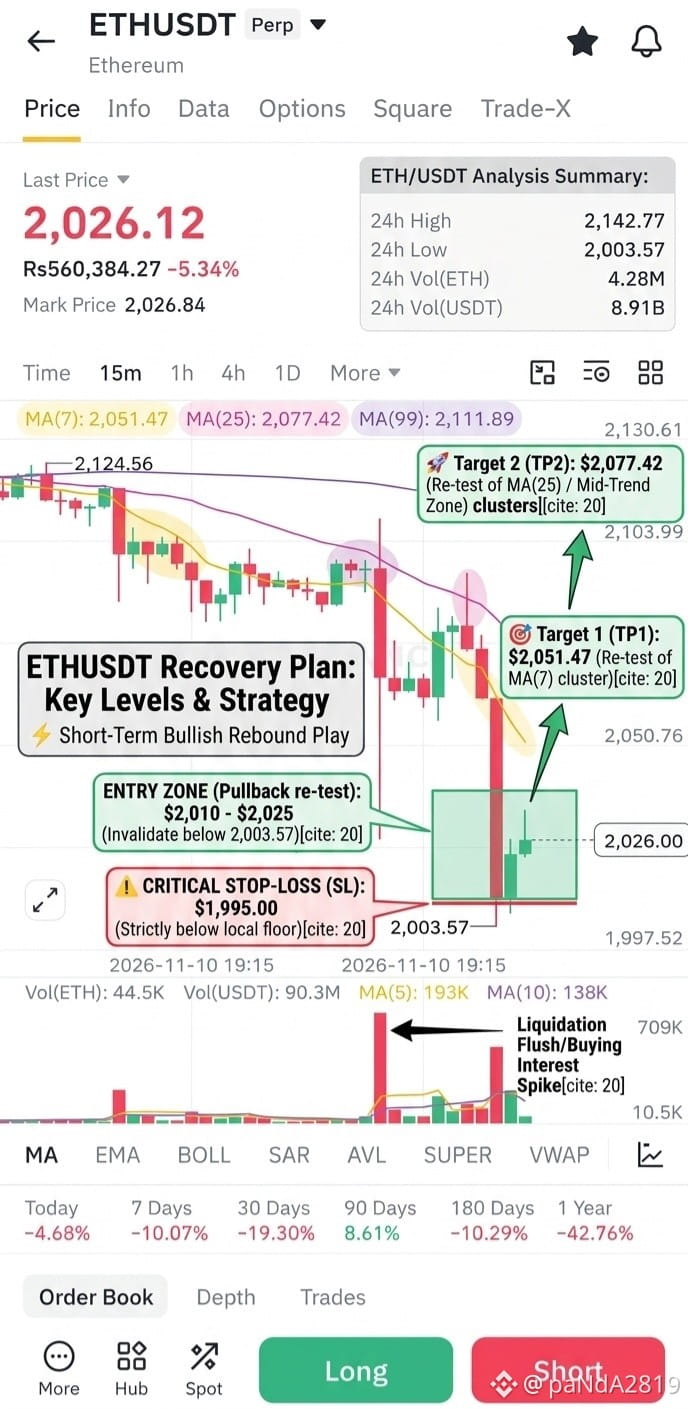
🚀 $ETH QUICK TECHNICAL ANALYSIS (15M Timeframe)
📈 Trend Overview:
• Status: Short-Term Oversold Rebound / Volatility Spike
• Key Event: Sharp liquidation drop down to the $2,003.57 support floor followed by an aggressive impulsive recovery candle, testing the MA(7) dynamic resistance
📊 Key Technical Levels (Moving Averages):
• Current Price: ~$2,026.12
• Entry Zone (Pullback Re-test): $2,010 – $2,025
• Primary Support Floor: $2,003.57 (24h Low / Liquidation Wick Low)
• Resistance Target 1 (TP1): $2,051.47 (MA(7) Level)
• Resistance Target 2 (TP2): $2,077.42 (MA(25) Level)
• Stop-Loss (SL): $1,995.00 (Strictly below the major 24h low support floor)
💡 Trade Note:
Ethereum experienced a sharp downside flush to $2,003.57 with high volume spike, immediately triggering a strong buying response. While short-term momentum is recovering, price remains below the key moving averages ($\text{MA}(7)$ at $2,051.47$ and $\text{MA}(25)$ at $2,077.42$). Look for a stable re-test and consolidation above $2,010 before scaling into long entries targeting the moving average resistance clusters. Manage risk tightly due to high volatility.
⚠️ Disclaimer:
Cryptocurrency trading involves substantial risk of loss and is not suitable for every investor. Technical analysis is based on historical market data and price action indicators; it does not guarantee future results. This content is published strictly for educational and informational purposes on Binance Square under the Write-to-Earn program and does not constitute financial or investment advice. Always perform your own research (DYOR) and manage your risk prudently before placing any trades.
#ETH #Ethereum #CryptoTrading #BinanceSquare #TechnicalAnalysis #CryptoNFA
📈 Trend Overview:
• Status: Short-Term Oversold Rebound / Volatility Spike
• Key Event: Sharp liquidation drop down to the $2,003.57 support floor followed by an aggressive impulsive recovery candle, testing the MA(7) dynamic resistance
📊 Key Technical Levels (Moving Averages):
• Current Price: ~$2,026.12
• Entry Zone (Pullback Re-test): $2,010 – $2,025
• Primary Support Floor: $2,003.57 (24h Low / Liquidation Wick Low)
• Resistance Target 1 (TP1): $2,051.47 (MA(7) Level)
• Resistance Target 2 (TP2): $2,077.42 (MA(25) Level)
• Stop-Loss (SL): $1,995.00 (Strictly below the major 24h low support floor)
💡 Trade Note:
Ethereum experienced a sharp downside flush to $2,003.57 with high volume spike, immediately triggering a strong buying response. While short-term momentum is recovering, price remains below the key moving averages ($\text{MA}(7)$ at $2,051.47$ and $\text{MA}(25)$ at $2,077.42$). Look for a stable re-test and consolidation above $2,010 before scaling into long entries targeting the moving average resistance clusters. Manage risk tightly due to high volatility.
⚠️ Disclaimer:
Cryptocurrency trading involves substantial risk of loss and is not suitable for every investor. Technical analysis is based on historical market data and price action indicators; it does not guarantee future results. This content is published strictly for educational and informational purposes on Binance Square under the Write-to-Earn program and does not constitute financial or investment advice. Always perform your own research (DYOR) and manage your risk prudently before placing any trades.
#ETH #Ethereum #CryptoTrading #BinanceSquare #TechnicalAnalysis #CryptoNFA