
━━━━━━━━━━━━━━━━━━━━
MARKET OVERVIEW
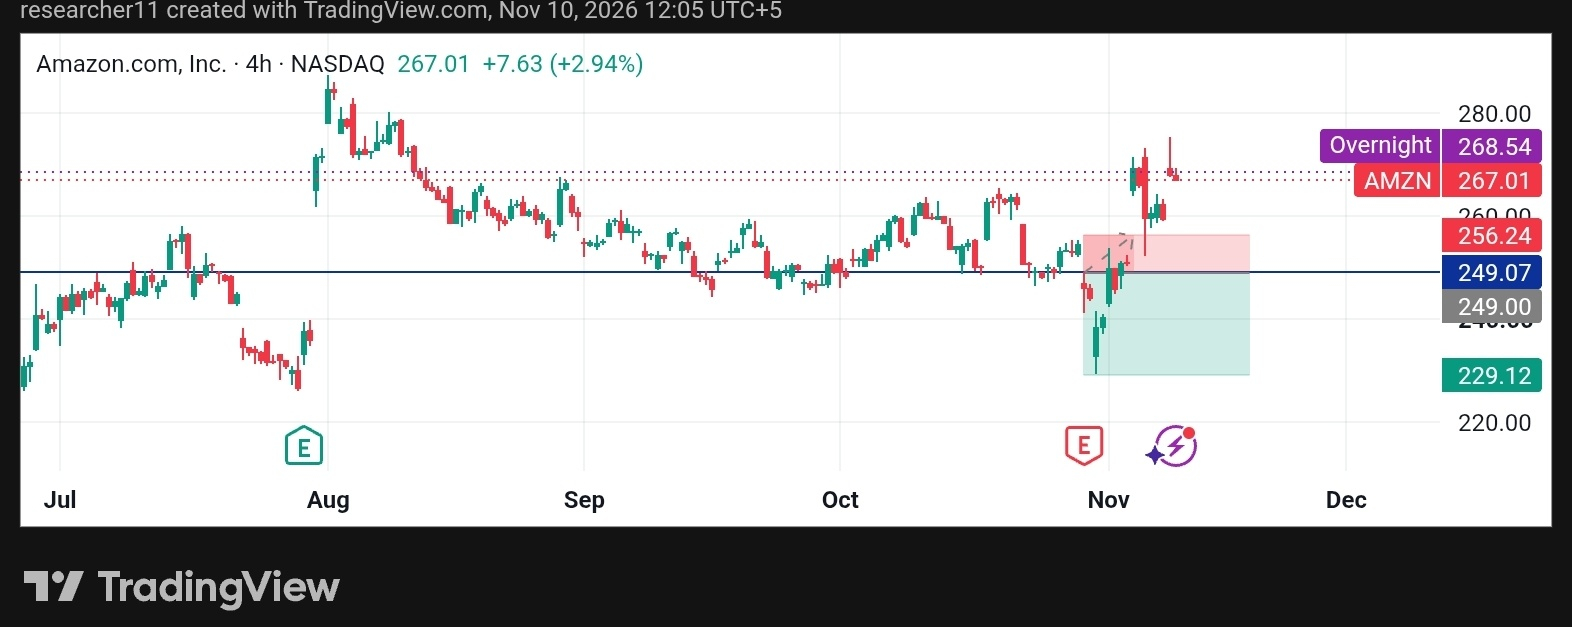
Amazon (AMZN) is trading near $267.01 on the 4H chart, up about 2.94% on the day. Price has moved strongly higher since the start of November, and volatility is high. Overnight trading near $268.54 shows the bullish momentum is still alive.
━━━━━━━━━━━━━━━━━━━━
TECHNICAL ANALYSIS
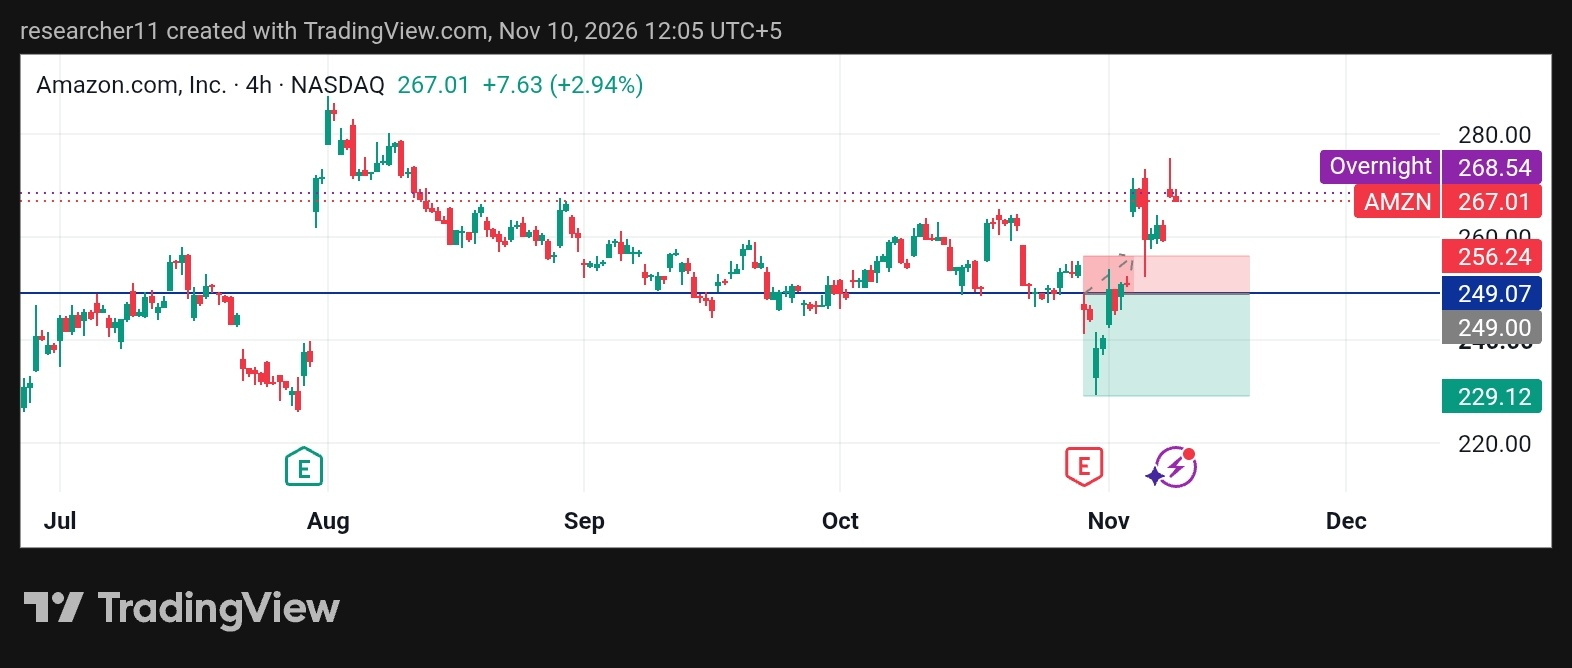
For weeks, price ranged around the $249 level, which acted as a pivot. In early November, buyers pushed price up from the lows and broke through $256.24 with strength. A bearish setup near that zone was invalidated by the breakout.
After the push, price spiked to roughly $275 and pulled back. The long upper wick shows sellers are active near the highs, so this area is worth monitoring. Still, higher lows and a clear reclaim of resistance keep the short-term trend bullish.
━━━━━━━━━━━━━━━━━━━━
SCENARIOS
🟢 Bullish Case: Holding above $256 and breaking above $268.54, then the recent wick high, would confirm continuation.
🔴 Bearish Case: A 4H close back below $256.24 would signal a failed breakout, with $249 as the next test.
⚪ Neutral Case: Price consolidates between $256 and $268 as the market digests the rally.
━━━━━━━━━━━━━━━━━━━━
KEY LEVELS
🔺 Resistance: R1: $268.54 | R2: ~$275 (recent wick high)
🔻 Support: S1: $256.24 | S2: $249.07
━━━━━━━━━━━━━━━━━━━━
CONCLUSION
AMZN has flipped a key resistance zone into potential support. The retest of $256 will show whether buyers are truly in control.
⚠️ This is market analysis for informational purposes only, not financial advice.
#AMZNB #CPITestsDecemberRateOutlook #NvidiaInvestigatesAfterHuang’sAffairApology $AMZN