
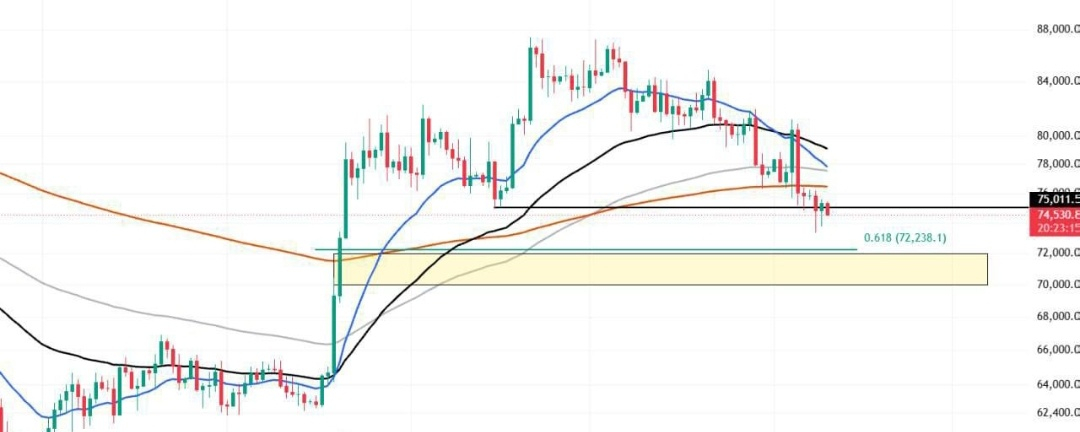

BTC is currently attempting to break below the 200-day moving average and the support level at 75K on the daily chart.
After forming a double top at 87K, it is gradually lowering its highs, and selling pressure is consistently emerging as trading volume increases during declines.
A short-term moving average crossover has occurred, and the current candlestick is located below all moving averages, suggesting that the short- to medium-term upward trend has temporarily stalled.
The 75K level, where it is currently struggling, is a significant support level from this rally, and it also coincides with a long-term moving average, making it the most important support zone currently.
Although it has fallen below 75K since November 8th, it has closed with a lower wick for two consecutive days, so it is not yet definitively considered a break below.
If it closes with a lower wick and receives support again today, a positive trend can be expected.
However, selling pressure remains strong, so it is necessary to prepare for further declines.
If it breaks below, the next key level to watch is the 72K-70K range, where a gap formed during the initial surge.
The 72K-70K range is also the 0.618 retracement level of this rally, and a scenario where it touches this level and then rebounds could be seen as a healthy trend, as it would help to clear accumulated leverage.
Even if it falls to the 72K-70K range, it is important to be cautious and observe how the candlesticks are formed and the overall context before considering buying.