
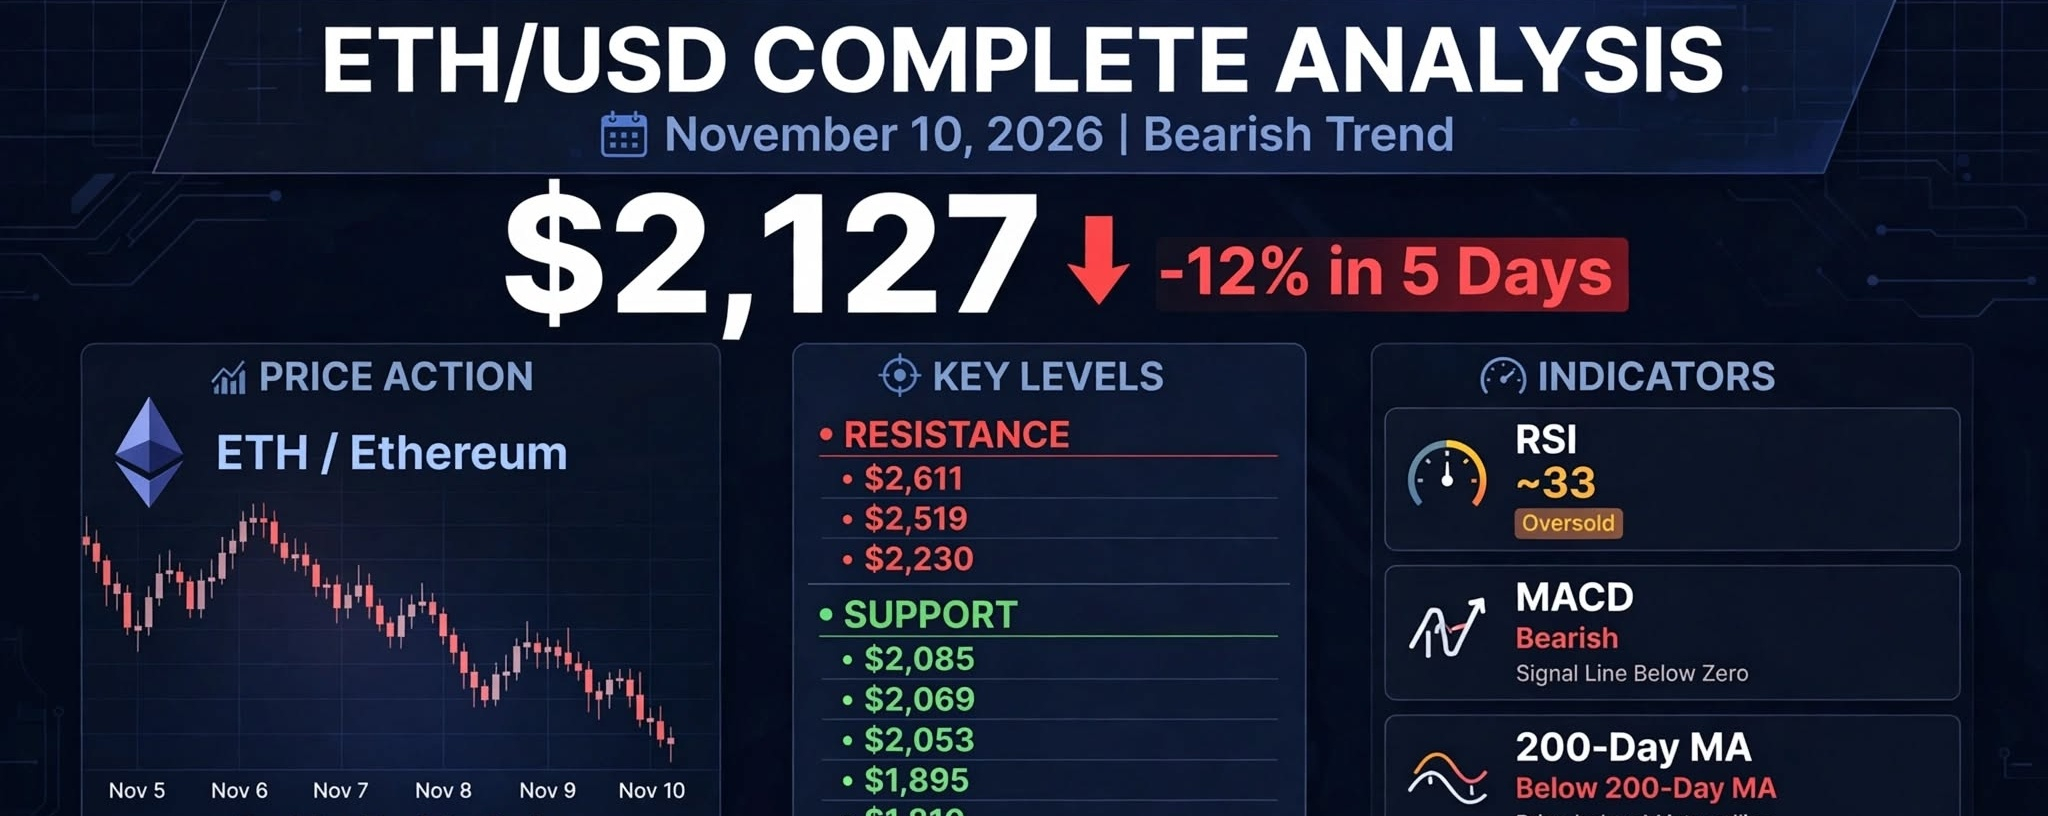

$ETH /USD — Complete Analysis November 10, 2026 | Price ∼$2,120 - $2,132

Technical + Fundamental analysis only. Not financial advice. Crypto is highly volatile — manage risk.
### 1. Current Market Snapshot
$ETH is trading in a clear downtrend and sitting right on its most important short-term decision zone.
Live price: $2,127.51 as of 2026-11-10 01:15 UTC on Binance ETH/USDT, with Open $2,135.82 / High $2,160.5 / Low $2,083.1
Other feeds today: $2,131.89, $2,130, $2,126.62 — all clustered $2,123 - $2,132
Market cap: ∼$255.44B - $260.5B
Performance: 5 sessions -12.06%, 1 month -20.81%, 6 months -10.08%, YTD -29.03%, 1 year -40.24%
That YTD -29% and 1-year -40% tells you this is not just a dip — it's a sustained bear market with lower highs since October.
Recent price action:
Nov 7: $2,238 -> Nov 8: $2,127 -> Nov 9: $2,132. The Nov 8 candle was brutal: Open $2,240.24, Low $2,060, Close $2,127.46. That $2,060 wick is now the flush low everyone is watching.
2. Key Levels — The Complete Map
Intraday / Short-Term
| Type | Level |
| --- | --- |
| Resistance 1 | $2,136 - $2,161 |
| Resistance 2 | $2,186 (intraday pivot) |
| Resistance 3 | $2,214 - $2,230 |
| Current | ~$2,127 |
| Support 1 | $2,102 - $2,085 |
| Support 2 | $2,069 |
| Support 3 | $2,053 - $2,060 (Nov 8 low) |
| Flush Low | $2,032 - $2,060 |
Independent technical feeds confirm this: nearest support $2,102 and nearest resistance $2,161 as of Nov 9, and 30-day range support $2,063 / resistance $2,580.
Daily / Swing
| Type | Level |
| --- | --- |
| Daily Pivot | $2,364 |
| Major Resistance | $2,519 |
| Major Resistance | $2,611 |
| Major Support | $1,895 |
| Deeper Support | $1,810 - $1,849 |
| Breakdown Target | $1,754 |
The battle zone is $2,085 - $2,100. Hold it = relief bounce possible. Lose it on a daily close = $1,895 becomes the magnet.
3. Technical Indicators
Trend: Bearish across all timeframes
Price vs MAs: $ETH is trading below MA-20 at $2,228 and MA-50 at $2,273 on H4, as well as below MA-200 at $2,156 on daily. Your 20D ∼$2,293, 50D ∼$2,470, 200D ∼$2,155 aligns — all overhead now act as resistance.
RSI Daily: ∼33 — weak, approaching oversold but NOT yet capitulation. In strong downtrends RSI can stay 25-35 for days.
MACD: Bearish, below signal line, no bullish flip yet.
Bollinger Bands: Price pushed below lower band — strong selling pressure, not a mean-reversion signal yet.
Ichimoku: Kijun at $2,328 is nearest resistance. Price is well below cloud.
TradingView Rating: Daily technical rating shows a Sell signal
What this means: Every bounce so far is being sold into overhead MAs. Until ETH reclaims $2,230 and then $2,364, bounces are relief, not reversal.
4. Fundamentals & Macro — Why It's Falling
A) ETF Outflows — The Main Pressure
This is the biggest structural headwind.
Ethereum ETFs suffered $365 million outflows Nov 2-6, extending a six-week losing streak
Combined BTC + ETH ETF withdrawals Nov 2-6 were ∼$1.65 billion
On Nov 6 alone: $93.19M outflows, after $99.9M on Nov 5
BlackRock's ETHA recorded a $90.76 million withdrawal on Nov 6, and accounted for most of the exits, while Fidelity's FETH took in only a modest $15 million
November outflows already ∼$272M, and total 2026 net outflows ∼$310M with assets falling from $17.95B to $13.04B
Institutional demand is not buying the dip — it's exiting.
B) Liquidations & Leverage
Recent selloff triggered $449M+ in leveraged long liquidations in your earlier data, and social charts from Nov 9 show the sharp decline to ∼$2,032 on the 4H chart. That flush cleared leverage but did not bring buyers back.
C) US CPI — Today's Catalyst
This is the biggest volatility event today.
October CPI due Nov 10 at 8:30 a.m. ET
Consensus: headline +0.2% to +0.3% MoM, core +0.2% MoM, annual headline near 3.7%
September was +0.6% MoM taking annual to 3.7%, its highest since May
This is the final major inflation reading before the Fed's December meeting
CPI Playbook:
Cooler than expected (Core <0.2%): Short-covering, relief rally. First targets $2,161 -> $2,186 -> $2,230
In-line (0.2%): Choppy, likely hold $2,100, grind to $2,186
Hotter (>0.3% Core): Dollar up, risk assets down. Break $2,085 -> flush to $2,053 -> $1,895
A cooler-than-feared CPI has historically triggered short-covering and a relief rally in crypto — but with ETF outflows, any rally may be capped.
#### D) On-Chain / Sentiment
On-chain activity surged to ATH in early November despite price fall, and staking rate keeps rising even as price fell from ∼$2,800 in October to $2,132 — a divergence analysts note as long-term confidence vs short-term selling. Social sentiment is mixed: some traders framing this as a "capitulation / SVB moment" setup, others warning about continued outflows.
5. Scenarios
🐻 Bearish Scenario (Probability: Higher, ∼60%)
Condition: Reject $2,186 - $2,230, lose $2,085 on daily close
Path: $2,085 -> $2,069 -> $2,053 -> $1,895 -> $1,810
If $1,810 breaks: $1,754
This is the trend-following path. ETF outflows + below 200D + CPI risk support it.
🐂 Bullish Relief Scenario (Probability: ∼35%)
Condition: Hold $2,100, reclaim $2,186
Path: $2,186 -> $2,214-$2,230 -> $2,300-$2,365
Strong confirmation only above $2,364 daily close -> $2,519 -> $2,611
This would be a relief bounce, not a new bull market, unless ETF flows turn positive.
➡️ Sideways / Range Scenario (Probability: ∼5% today due to CPI)
Condition: CPI in-line, hold $2,085 - $2,161 range into close. Low probability because CPI usually breaks ranges.
6. Trading Plan — Levels to Watch Today
For Intraday Traders:
Above $2,161: Bias shifts to long toward $2,186. Stop below $2,130.
Between $2,085 - $2,161: No-man's land, wait for CPI.
Below $2,085: Short bias, targets $2,069 / $2,053. Stop above $2,110.
For Swing Traders:
Bullish invalidation: Daily close below $2,053
Bearish invalidation: Daily close above $2,230
Trend flip: Daily close above $2,364
Risk Note: Do not chase CPI spike in first 5 minutes. Whipsaws around $2,100 are common. Wait for 1H close above/below level.
7. Outlook Summary
| Timeframe | Bias | Key Level |
| --- | --- | --- |
| Short-term (1-3 days) | 🔴 Bearish | $2,100 must hold |
| Medium-term (1-4 weeks) | 🔴 Bearish | $2,230 to flip |
| Long-term (1-3 months) | 🟡 Bearish, approaching major support | $1,895 - $1,810 zone |
| Bullish Confirmation | — | Daily close > $2,364 |
| Bearish Confirmation | — | Daily close < $2,085 |
Bottom Line: ETH is under significant selling pressure, below all major MAs, with 6 weeks of ETF outflows and CPI today. The $2,085-$2,100 zone is the line in the sand. Hold it and we get a relief bounce to $2,230-$2,365. Lose it and $1,895 is the next major target, with deeper risk to $1,810.
#Ethereum #ETHUSDTANALYSIS #ETHAnalysis #ETHUSDT #TrendingTopic