[November 9 Bitcoin chart analysis]
BTCUSD 30Min Chart
*My analysis is optimized for TradingView.
If you press the replay button, you can check real-time movements.
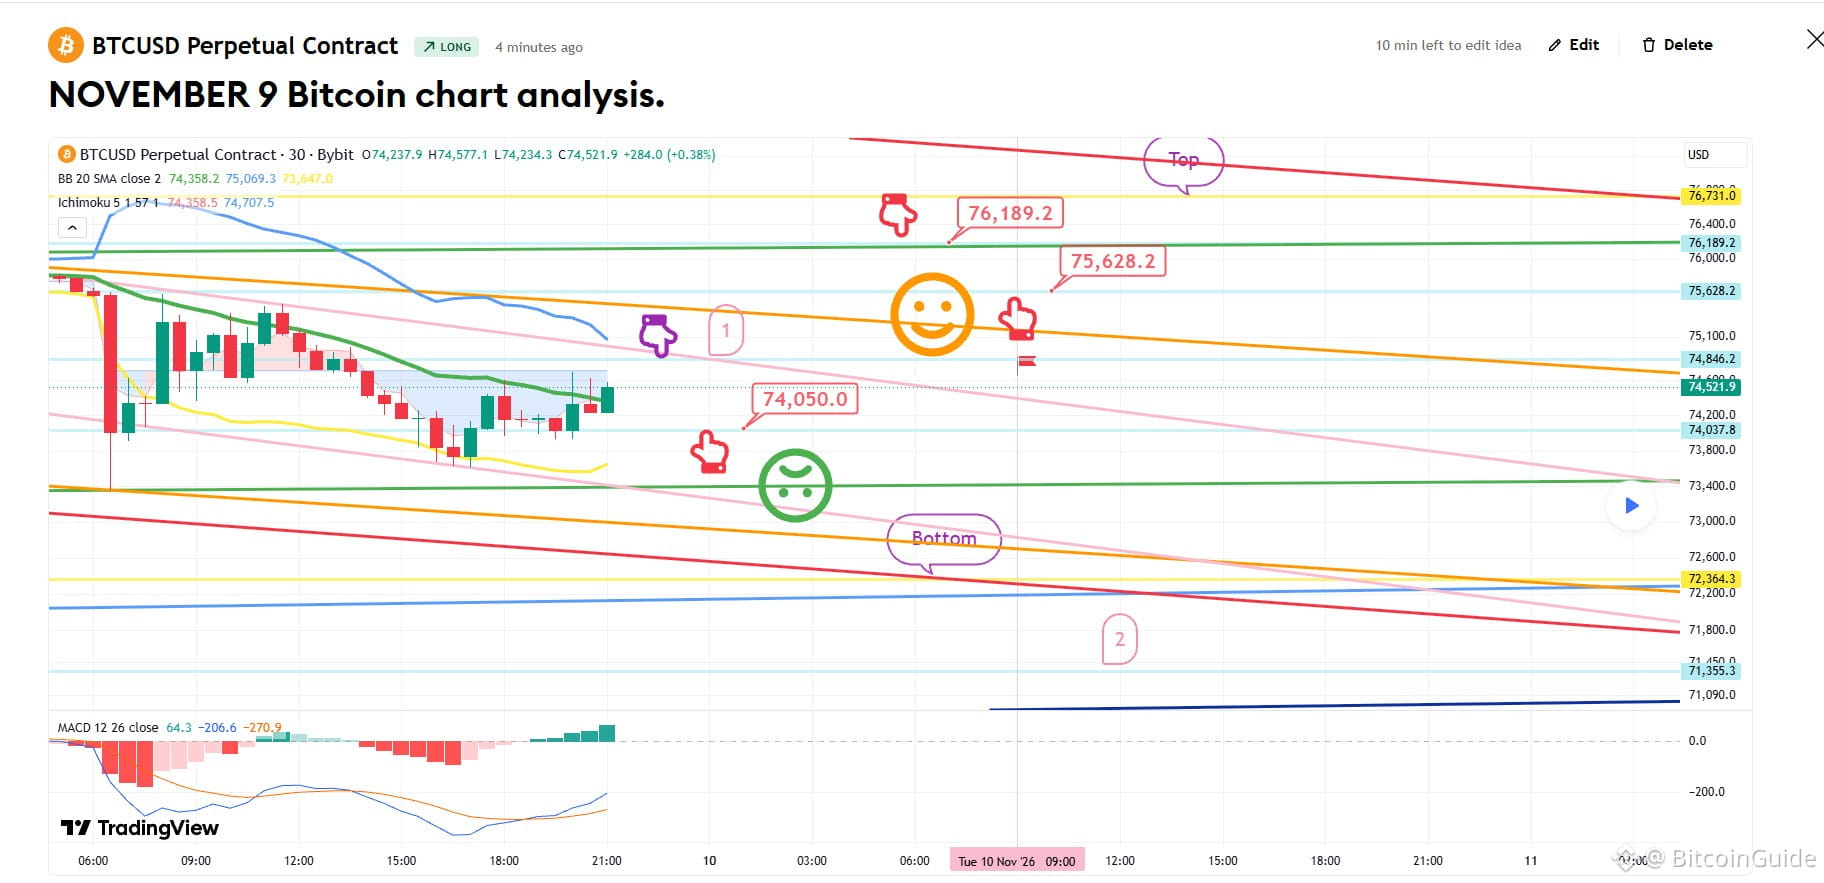
A new weekly candle has formed, and the price has reached a major support level. However, we are seeing a "second touch" (retest) in progress, accompanied by a bearish MACD crossover. Given that the Nasdaq has not pulled back as deeply as anticipated, we may face a challenging week if the two assets remain positively correlated.
*Strategy: Long position following a touch of the area marked by the purple arrow (labeled '1').
1) After confirming a touch of the area marked by the purple arrow (labeled '1')—where you might consider a short position—look to enter a long position at the level marked by the red arrow ($74,050). Use the green support line as your stop-loss level.
2) The first target for the long position is $76,189.2, with the "Top" level serving as the second target. If the strategy plays out successfully, the $75.6K level can be used as an entry point to re-enter a long position.
If the price drops directly without touching the area marked by '1' at the top, wait for a long entry at the "Bottom" level. Use the light blue support line as your stop-loss. Please be aware that if this level is breached, the price could potentially fall as far as the area marked '2'.
Please treat this analysis as a reference only. Ensure you trade according to your own principles and always use stop-loss orders to keep your trading safe.
I post the analysis results as a Comment every day.
Thank you.
(You can find the link on my profile.)
- Click Follow to receive faster information every day.
- Check the results using the replay button on TradingView.
#BTC Price Analysis# #Bitcoin #BTC100K #Altcoin Season# $XRP $USDC $BNB $USDT
BTCUSD 30Min Chart
*My analysis is optimized for TradingView.
If you press the replay button, you can check real-time movements.
A new weekly candle has formed, and the price has reached a major support level. However, we are seeing a "second touch" (retest) in progress, accompanied by a bearish MACD crossover. Given that the Nasdaq has not pulled back as deeply as anticipated, we may face a challenging week if the two assets remain positively correlated.
*Strategy: Long position following a touch of the area marked by the purple arrow (labeled '1').
1) After confirming a touch of the area marked by the purple arrow (labeled '1')—where you might consider a short position—look to enter a long position at the level marked by the red arrow ($74,050). Use the green support line as your stop-loss level.
2) The first target for the long position is $76,189.2, with the "Top" level serving as the second target. If the strategy plays out successfully, the $75.6K level can be used as an entry point to re-enter a long position.
If the price drops directly without touching the area marked by '1' at the top, wait for a long entry at the "Bottom" level. Use the light blue support line as your stop-loss. Please be aware that if this level is breached, the price could potentially fall as far as the area marked '2'.
Please treat this analysis as a reference only. Ensure you trade according to your own principles and always use stop-loss orders to keep your trading safe.
I post the analysis results as a Comment every day.
Thank you.
(You can find the link on my profile.)
- Click Follow to receive faster information every day.
- Check the results using the replay button on TradingView.
#BTC Price Analysis# #Bitcoin #BTC100K #Altcoin Season# $XRP $USDC $BNB $USDT