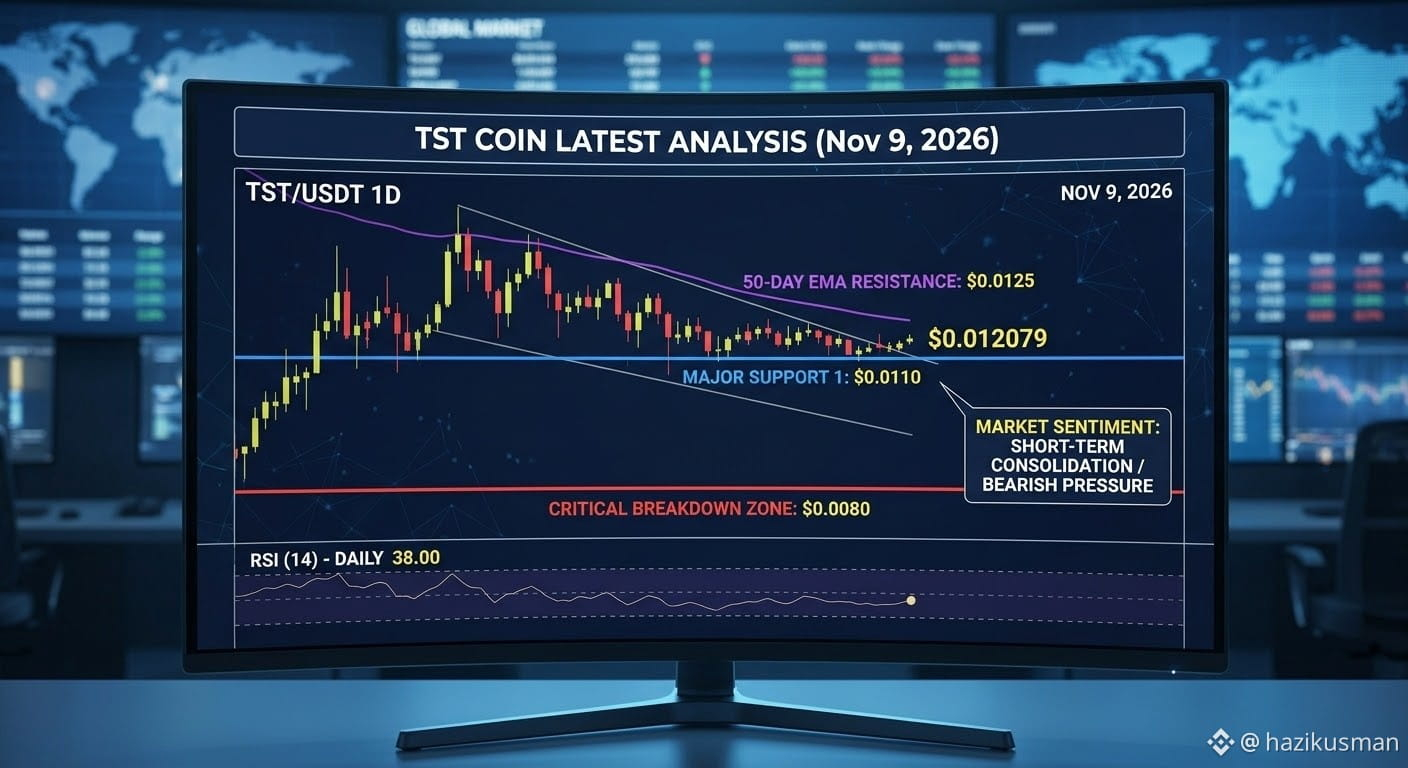
$TST is navigating a consolidation phase, reflecting the broader market uncertainty following systemic shocks. The token is trading in a defined range, battling to hold critical support levels while facing strong overhead resistance.
Short-Term Technical Outlook: Neutral to Bearish Pressure
Current Range: TST is defined by a narrow trading band between $0.011 and $0.0135. This region represents a battlefield where accumulation is attempting to counteract selling pressure.
Key Support: The primary defensive line is established at $0.011. A breakdown below this level, particularly with high volume, could invalidate the local structure and risk a retest of psychological support at $0.008.
Immediate Resistance: Significant selling supply is stacked around $0.0125, the position of the sloping 50-day Exponential Moving Average (EMA). For a trend shift to occur, bulls must reclaim the $0.0135 upper boundary of the current consolidation, which would pave the way toward structural resistance at $0.016.
Momentum Indicators: Indicators such as the Daily Relative Strength Index (RSI) are hovering near 38, reflecting dominant bearish momentum without yet reaching oversold conditions.
The infographic below captures the essential technical dynamics discussed above. It visualizes the current descending channel pattern, highlighting how TST is testing the key support zone. The graph distinctly marks the primary resistance barriers (EMA) and the multi-month support areas that define the current market bias.
#AnthropicRejectsIPODelayValuationinQuestion #BinanceSquareTalks #CryptocurrencyWealth #EarnMoney
Short-Term Technical Outlook: Neutral to Bearish Pressure
Current Range: TST is defined by a narrow trading band between $0.011 and $0.0135. This region represents a battlefield where accumulation is attempting to counteract selling pressure.
Key Support: The primary defensive line is established at $0.011. A breakdown below this level, particularly with high volume, could invalidate the local structure and risk a retest of psychological support at $0.008.
Immediate Resistance: Significant selling supply is stacked around $0.0125, the position of the sloping 50-day Exponential Moving Average (EMA). For a trend shift to occur, bulls must reclaim the $0.0135 upper boundary of the current consolidation, which would pave the way toward structural resistance at $0.016.
Momentum Indicators: Indicators such as the Daily Relative Strength Index (RSI) are hovering near 38, reflecting dominant bearish momentum without yet reaching oversold conditions.
The infographic below captures the essential technical dynamics discussed above. It visualizes the current descending channel pattern, highlighting how TST is testing the key support zone. The graph distinctly marks the primary resistance barriers (EMA) and the multi-month support areas that define the current market bias.
#AnthropicRejectsIPODelayValuationinQuestion #BinanceSquareTalks #CryptocurrencyWealth #EarnMoney