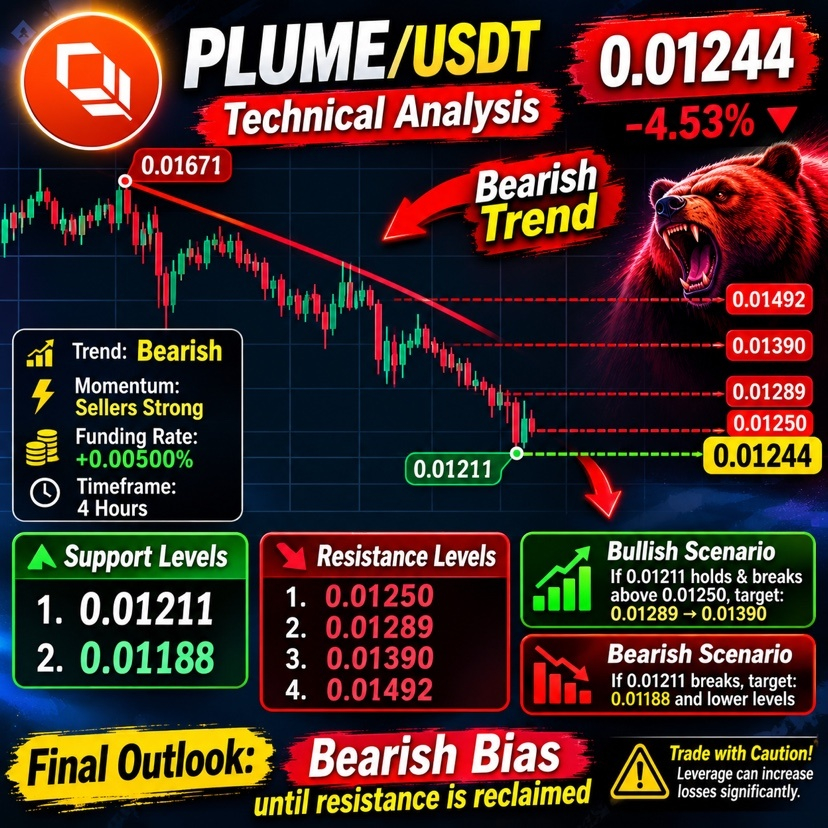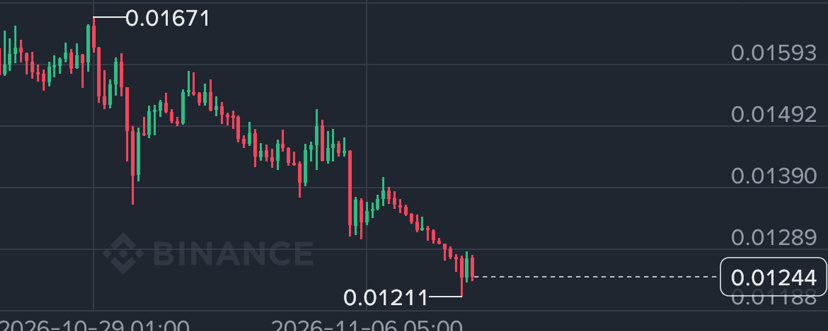

Based on your Binance screenshot, PLUME/USDT is showing significant selling pressure. The overall 4-hour chart structure is bearish, with lower highs and lower lows.
1. Current Market Overview
PLUME/USDT
-4.53%
0.01244 USDT
Price shown in your screenshot
Previous visible high
0.01671
Recent visible low
0.01211
Funding rate
+0.00500%
Chart timeframe
4 Hours
2. Technical Analysis
A. Overall Market Trend
The chart shows a clear downward trend.
Sellers are controlling the market.
Price continues making lower highs.
Each recovery has faced selling pressure.
Buyers have not yet demonstrated a strong reversal.
This suggests that bearish momentum remains dominant.
B. Important Support Levels
These are the key downside levels visible on your chart:
Support
Price
First support
0.01211
Second support
0.01188
If the price breaks below 0.01211 with a strong 4-hour candle close, the next visible support area is around 0.01188.
C. Important Resistance Levels
Resistance
Price
First resistance
0.01250
Second resistance
0.01289
Third resistance
0.01390
Major resistance
0.01492
The 0.01250–0.01289 region is particularly important for a possible recovery.
3. Order Book Analysis
Your screenshot shows the following visible orders.
Sell orders (red)
Price
Amount
0.01250
712.55K
0.01249
1.52M
0.01248
959.90K
0.01247
781.40K
0.01246
937.22K
Buy orders (green)
Price
Amount
0.01243
115.99K
0.01242
623.28K
0.01241
1.48M
0.01240
994.07K
0.01239
1.30M
0.01238
1.98M
There is visible selling liquidity above the current price and buying liquidity below it.
However, order-book quantities can change quickly. They do not guarantee that price will move in either direction.
4. Bullish vs Bearish Scenarios
Bullish scenario
If PLUME holds above 0.01211 and moves back above 0.01250, buyers may attempt a recovery toward:
0.01289
0.01390
A strong 4-hour close above resistance would provide better evidence of a trend recovery.
Bearish scenario
If PLUME loses 0.01211 and confirms a breakdown on the 4-hour timeframe, downside pressure could increase toward:
0.01188
Lower levels would need fresh chart data to identify.
5. Important Market Observations
Trend: Currently bearish.
Momentum: Sellers appear stronger than buyers.
Support: 0.01211 is an important level to monitor.
Resistance: 0.01250 is the first nearby obstacle.
Reversal confirmation: A higher high and a strong 4-hour close above resistance would improve the bullish outlook.
Funding: Positive funding of 0.005% indicates a positive funding rate, but does not establish market direction.
6. Final Market Outlook
Bearish bias until resistance is reclaimed
My technical reading is that PLUME is still under bearish pressure. The most important level to watch is 0.01211.
A break below this level could increase downside risk, while a recovery above 0.01250 followed by 0.01289 would improve the short-term outlook.
Risk warning: Your screenshot displays Cross margin and 20x leverage. Futures leverage can magnify losses substantially. These chart levels are educational observations, not guaranteed targets or a recommendation to open a trade.
7. What I would monitor next
The next 4-hour candle close.
Whether 0.01211 holds.
Whether buyers can reclaim 0.01250.
Whether selling volume decreases during a recovery.
This analysis uses only the chart and order-book snapshot you provided. It does not include independently verified live market data or current PLUME news.