I DON'T NEED TO SHOW YOU PERFECT PREDICTIONS. I CAN SHOW YOU MY HISTORY.
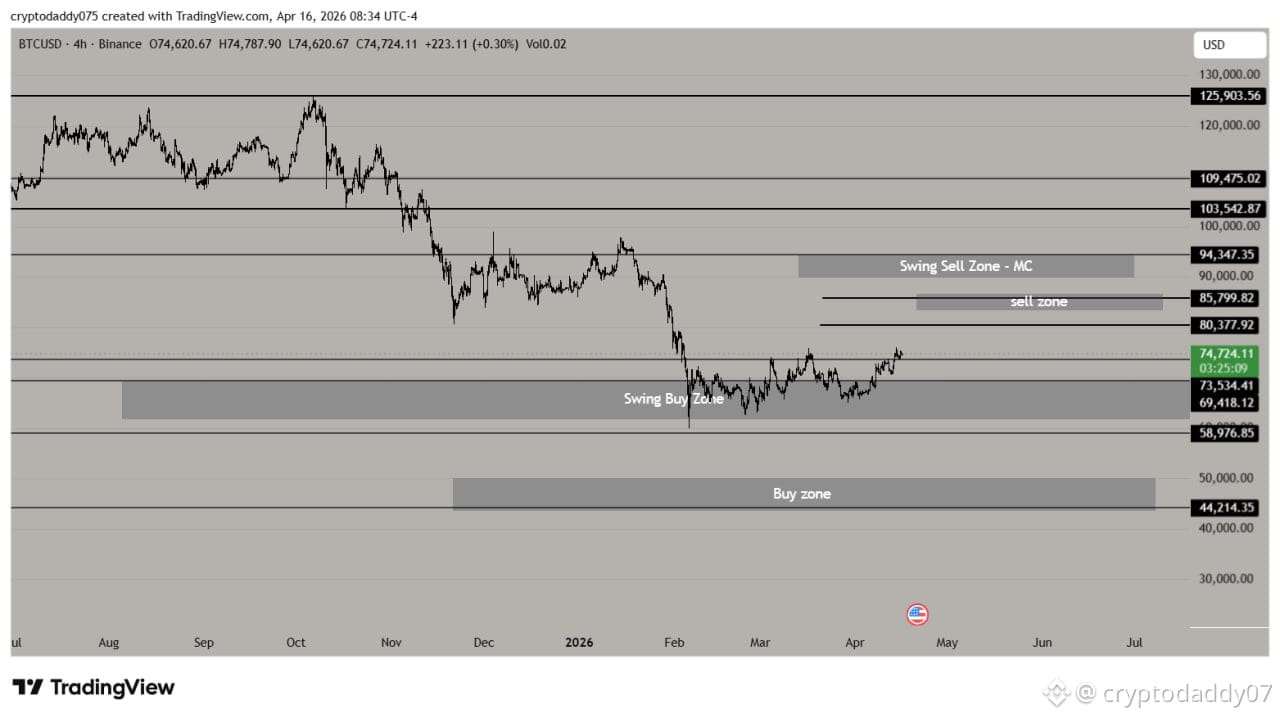
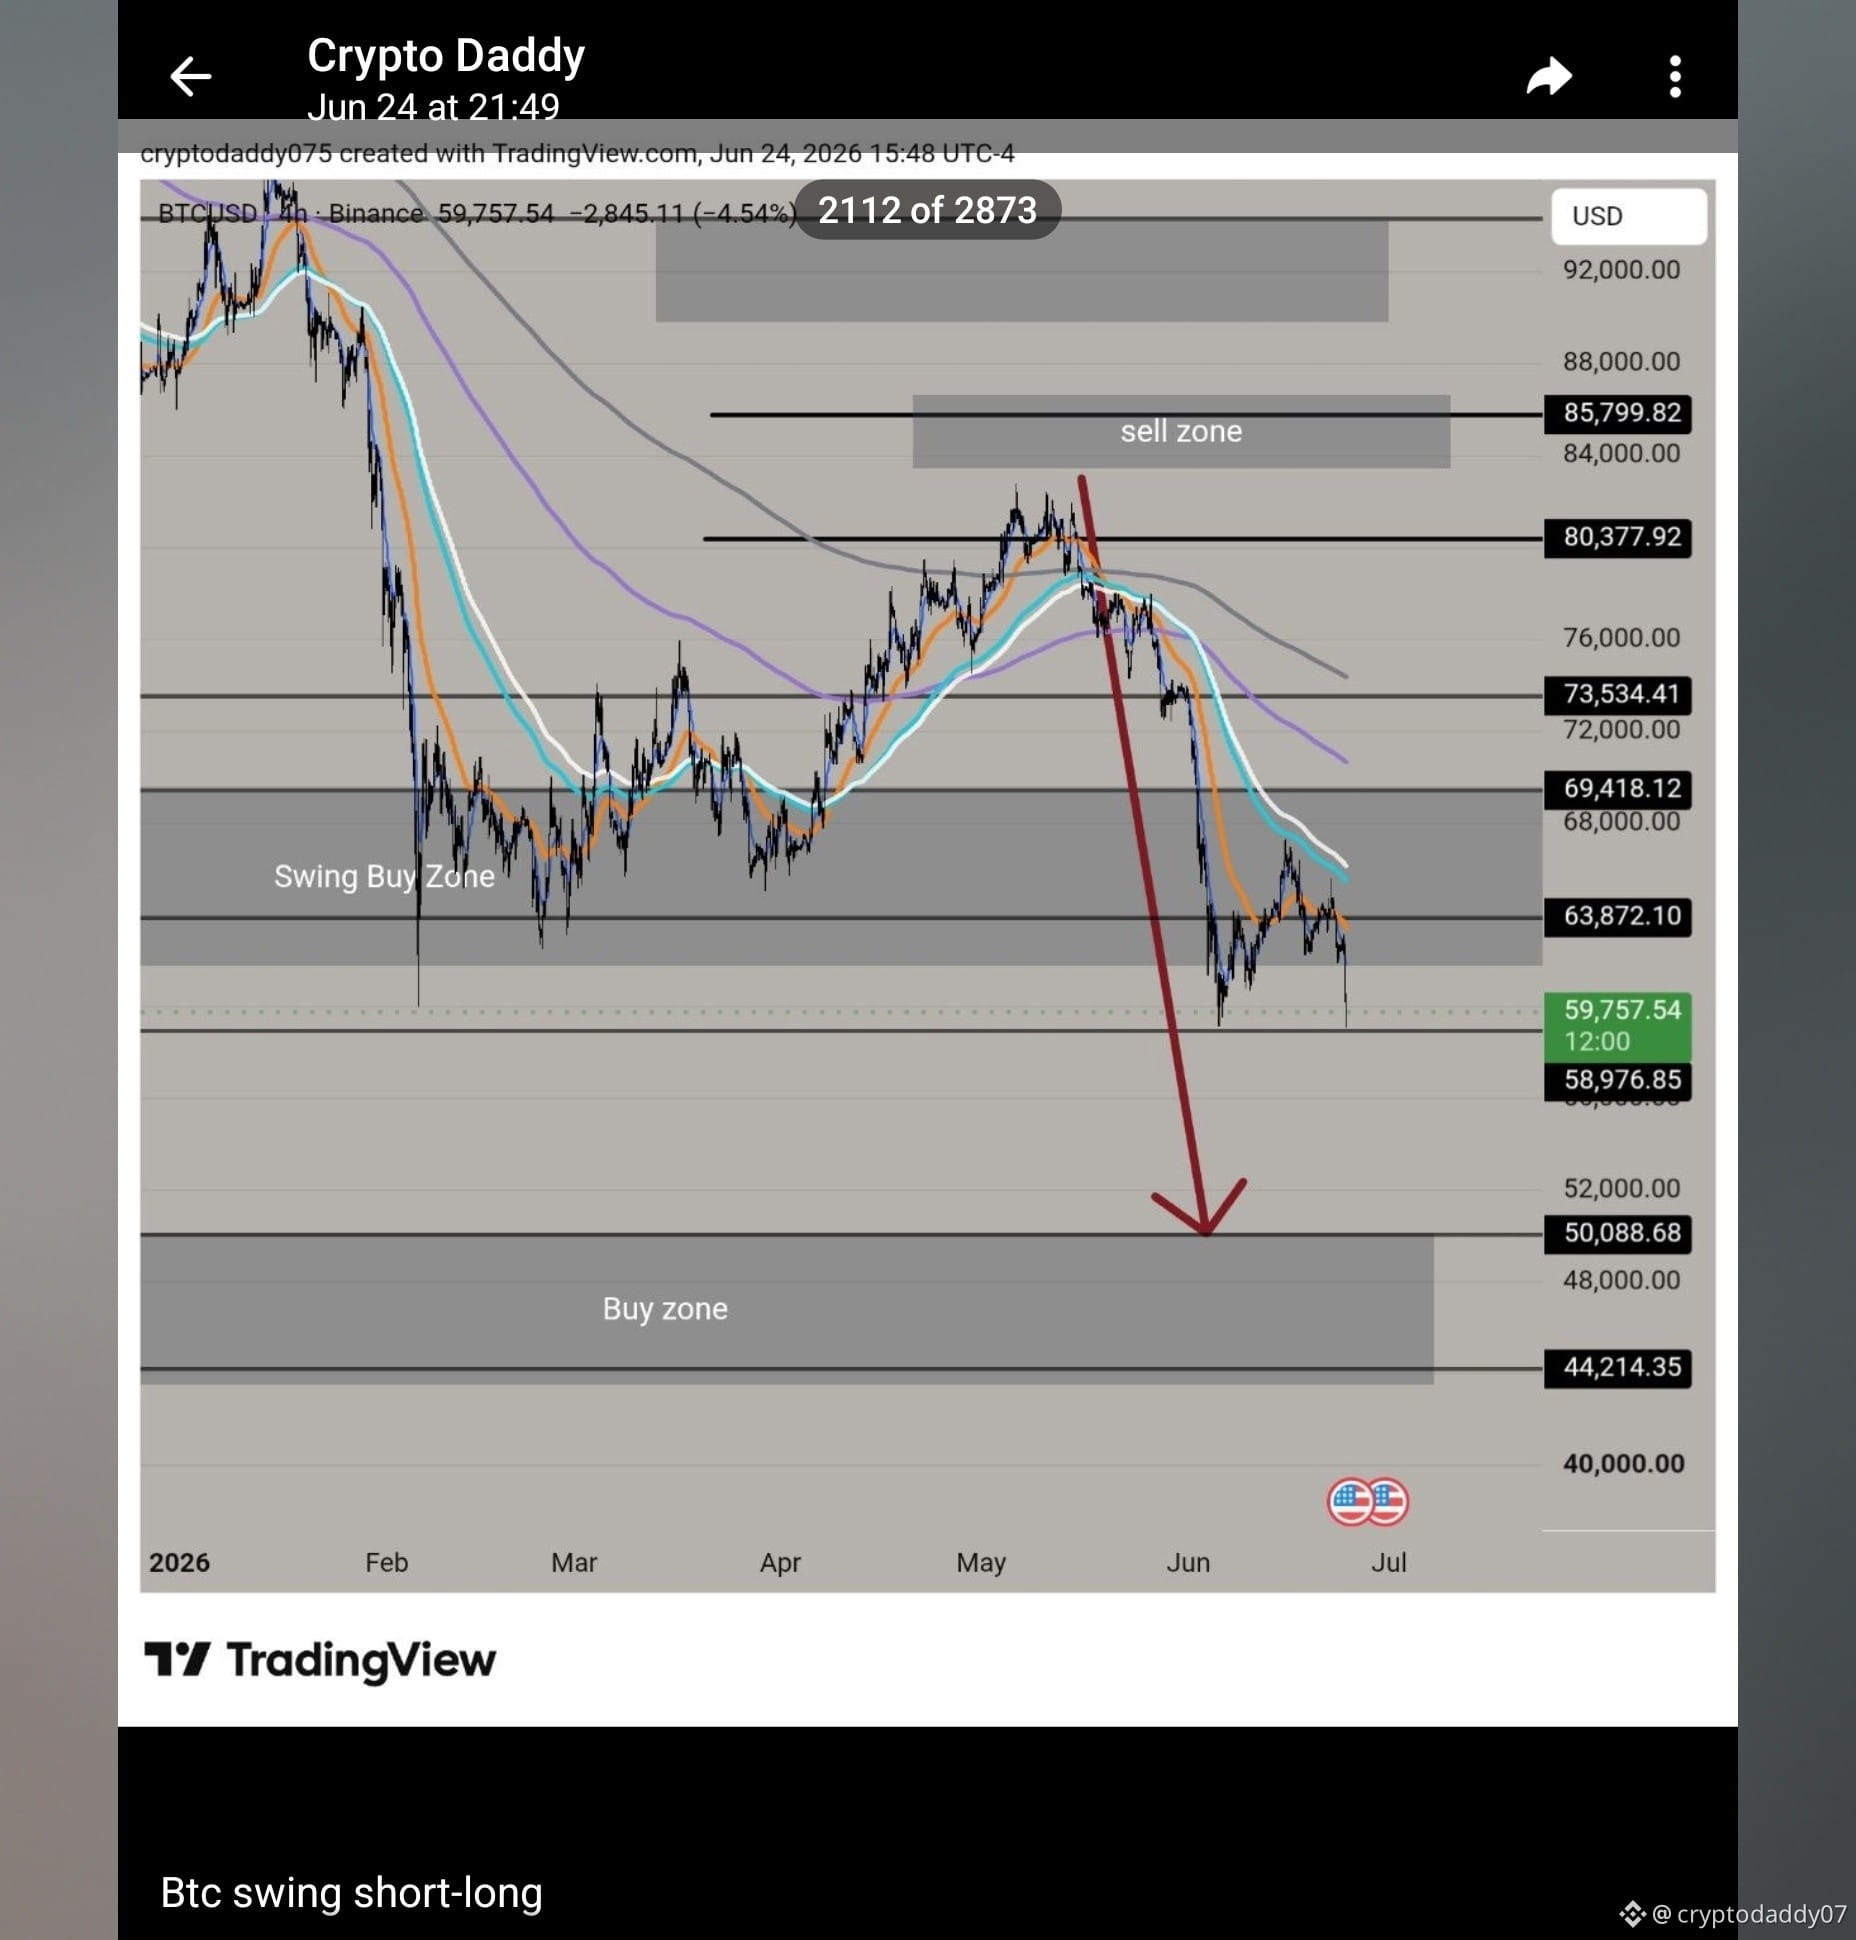
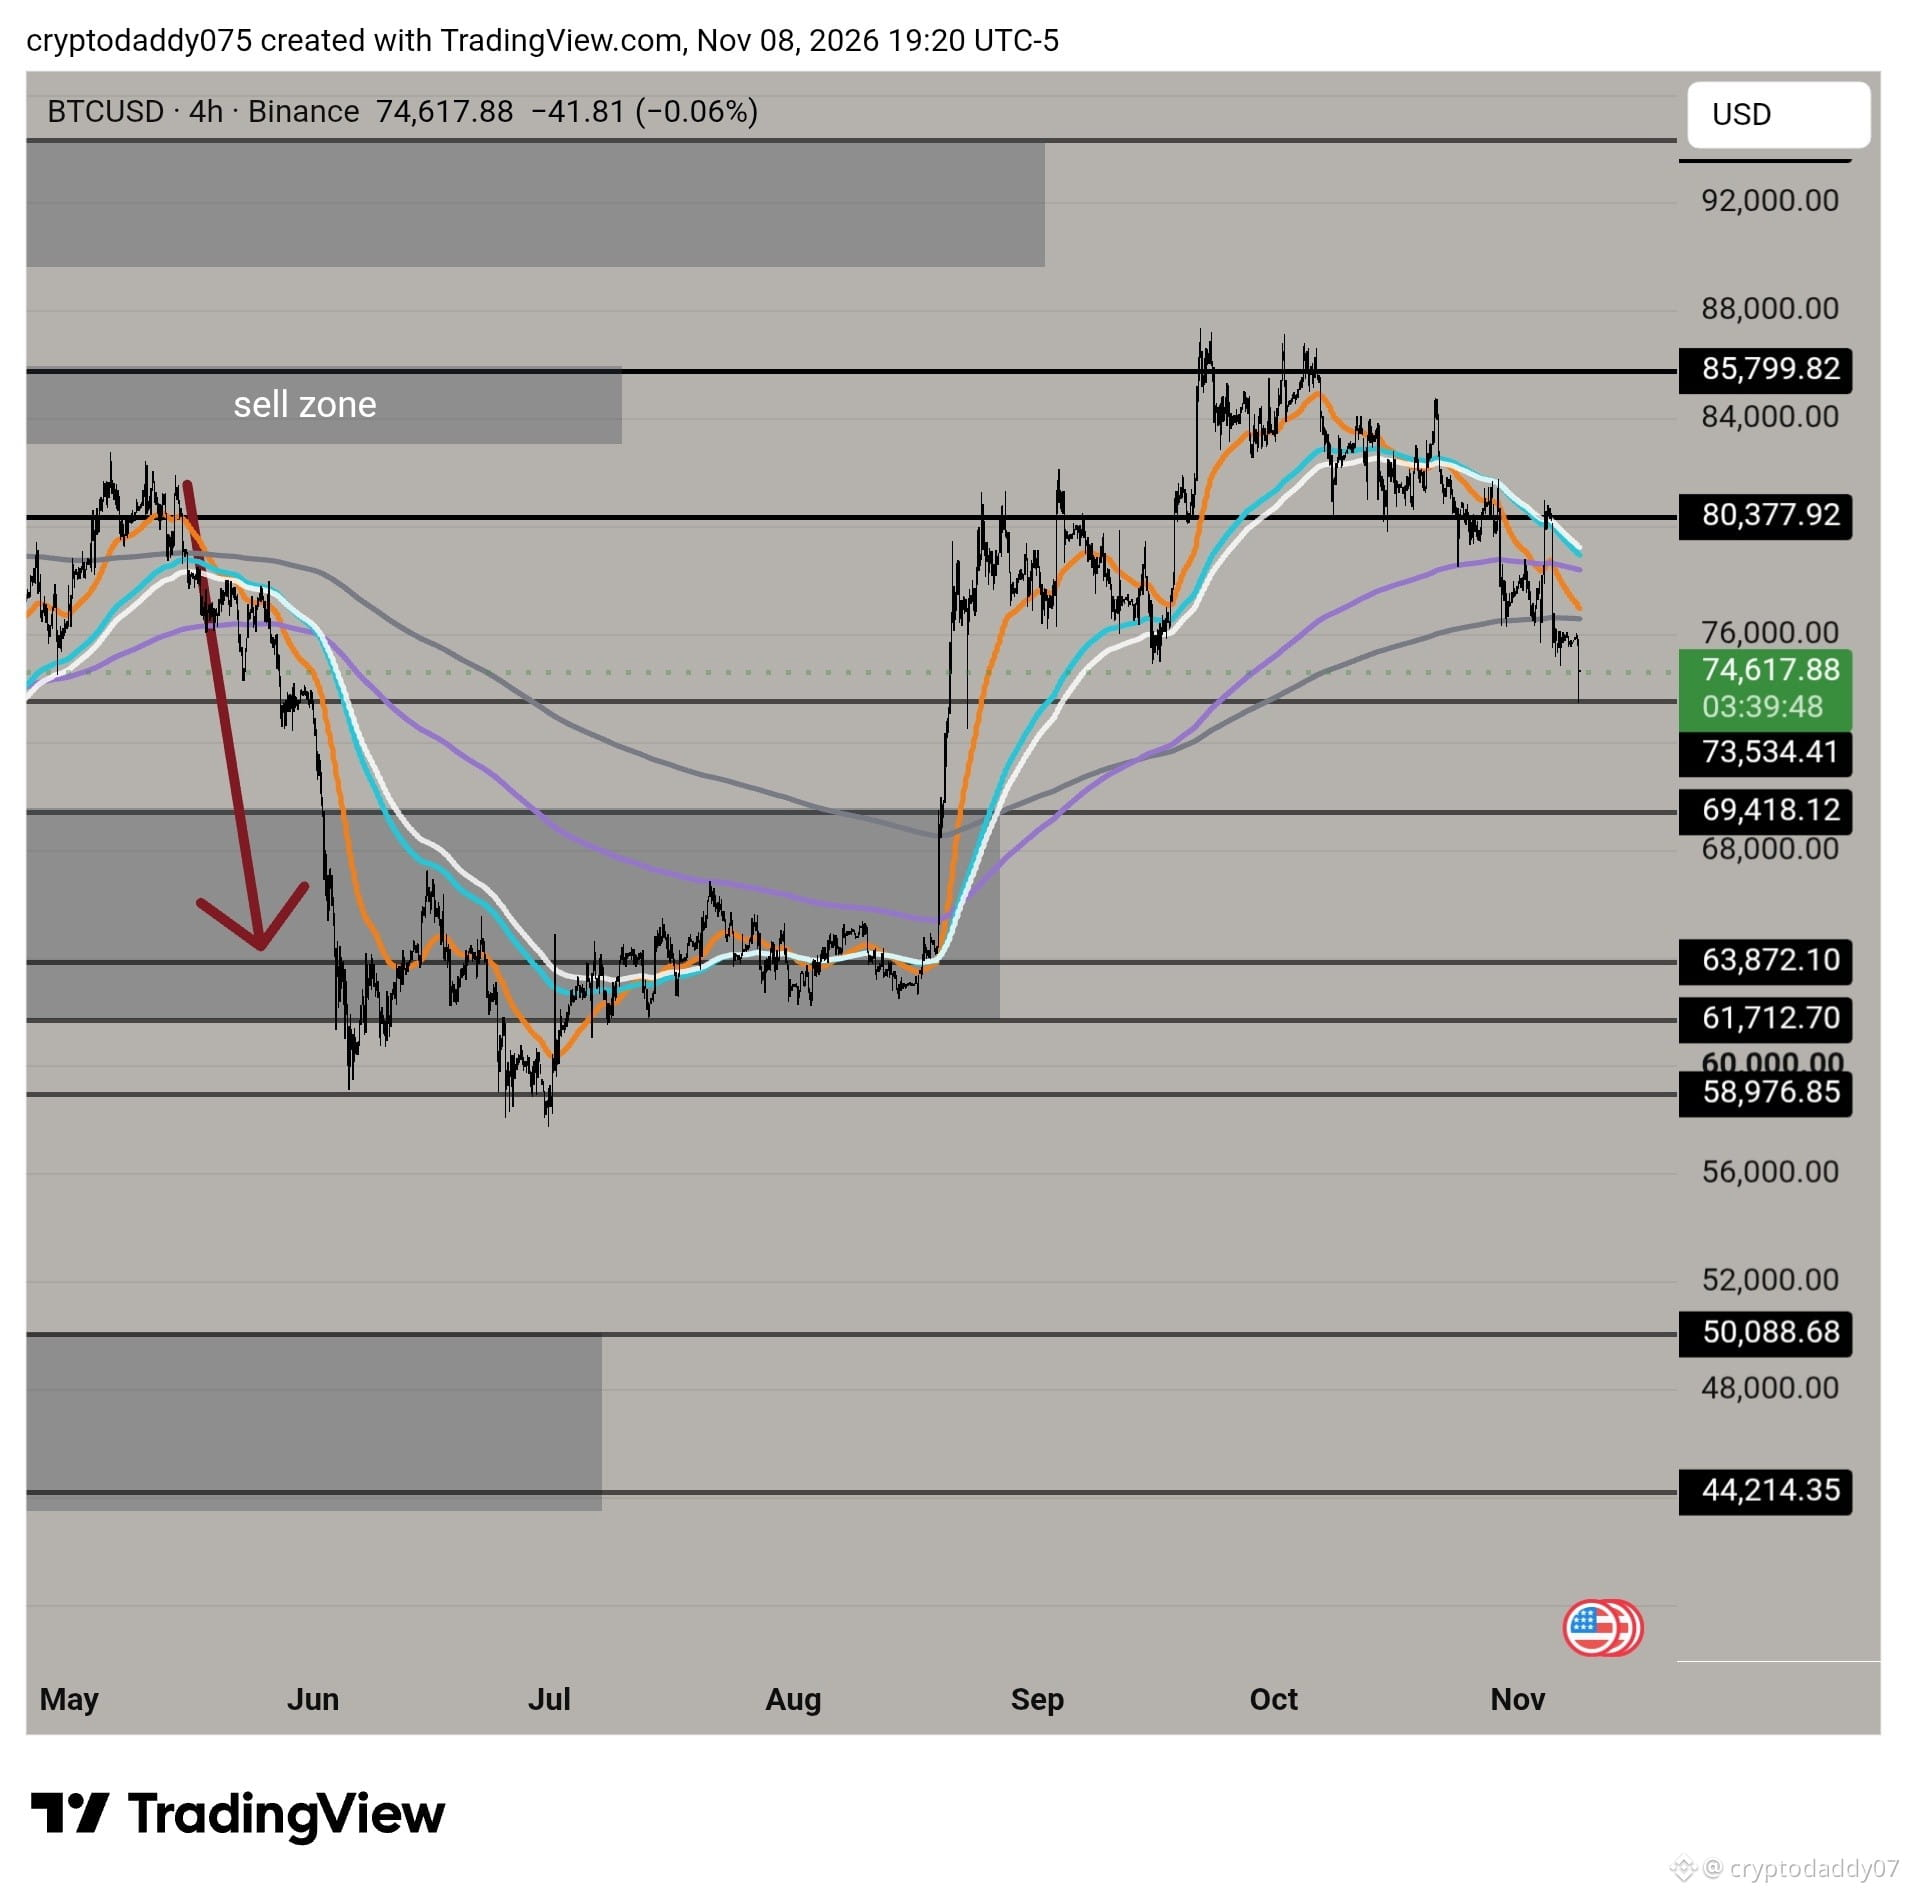
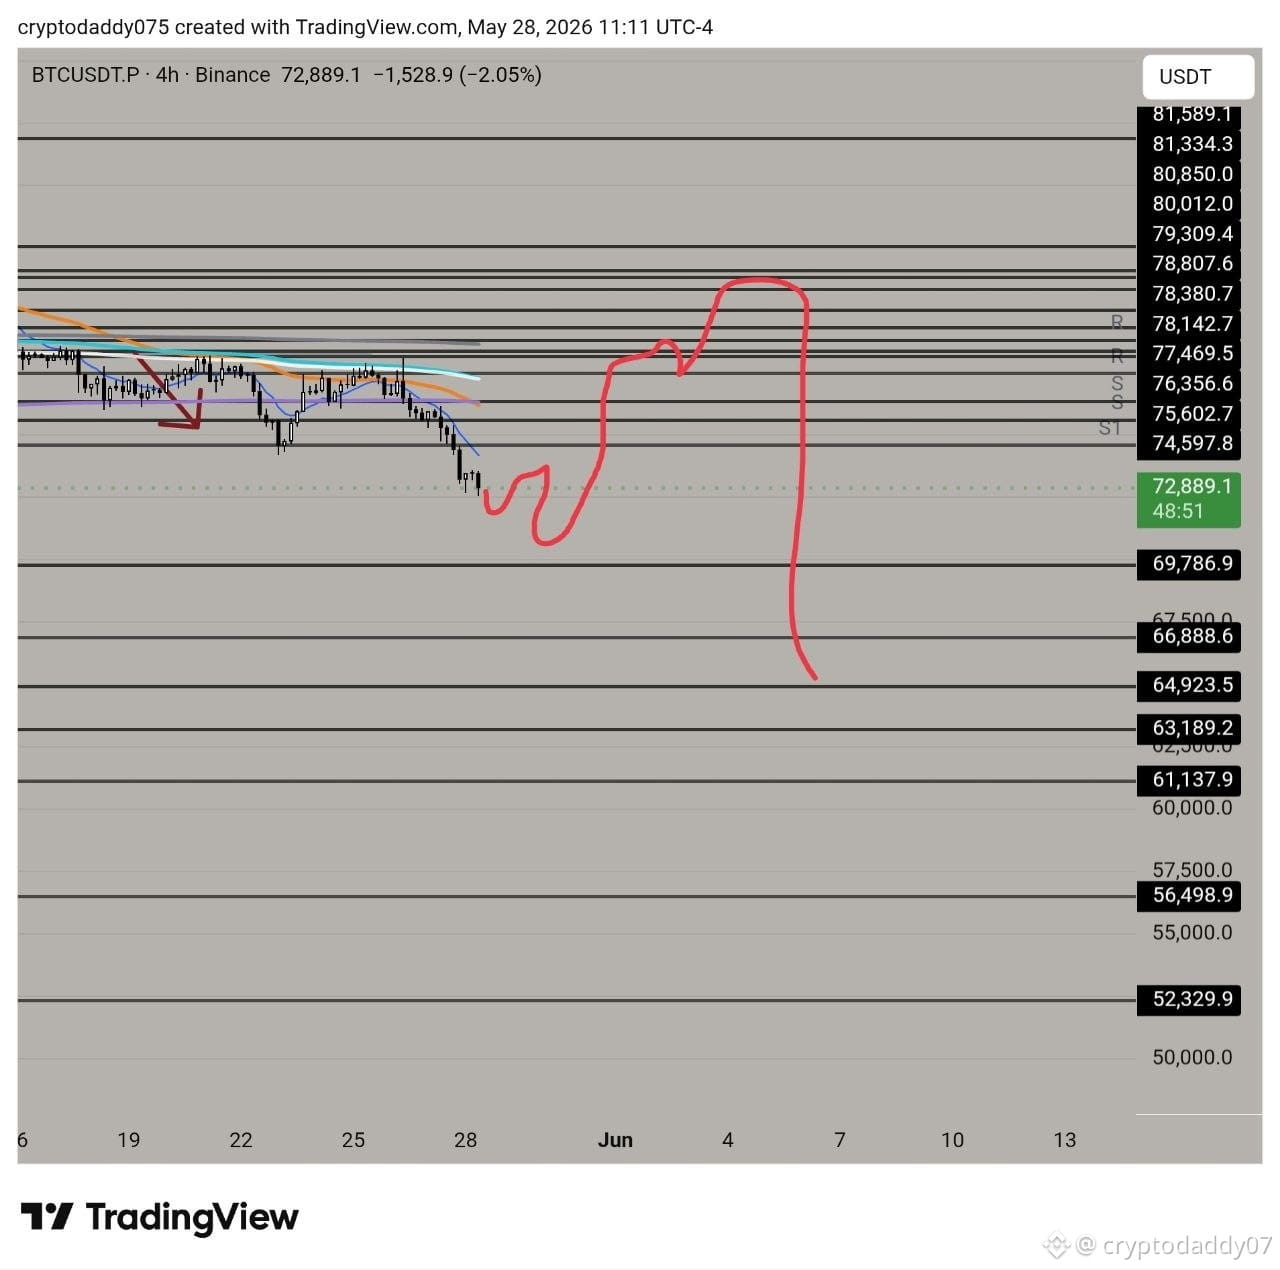
April. May. June. November.
For months, I've been sharing my BTC SPOT SWING analysis, with actual TradingView charts, key levels, buy zones, sell zones and different market scenarios.
And here's what matters:
In June, when Bitcoin was around $59K–$60K, I changed my outlook and told my community:
"Forget $50K. I'm bullish from here."
Bitcoin eventually climbed towards $87K.
Now, after that recovery and the latest correction, BTC is around $74K–$75K.
Am I saying $50K is coming now? NO.
Am I saying $70K is guaranteed to hold? NO.
I'm waiting for the next high-quality SPOT SWING entry, wherever the chart gives me confirmation.
$70K, $60K or $50K — the number doesn't matter.
A trader's job isn't to defend an old prediction. It's to adapt when the market changes.
The original charts, dates and levels are available in my FREE Telegram group. Scroll up and check the history.
No hindsight analysis. No pretending. Just charts, levels, strategy and patience.
I FOLLOW THE MARKET. I DON'T MARRY A PRICE TARGET.
— Crypto Daddy | LEVEL TO LEVEL.
April. May. June. November.
For months, I've been sharing my BTC SPOT SWING analysis, with actual TradingView charts, key levels, buy zones, sell zones and different market scenarios.
And here's what matters:
In June, when Bitcoin was around $59K–$60K, I changed my outlook and told my community:
"Forget $50K. I'm bullish from here."
Bitcoin eventually climbed towards $87K.
Now, after that recovery and the latest correction, BTC is around $74K–$75K.
Am I saying $50K is coming now? NO.
Am I saying $70K is guaranteed to hold? NO.
I'm waiting for the next high-quality SPOT SWING entry, wherever the chart gives me confirmation.
$70K, $60K or $50K — the number doesn't matter.
A trader's job isn't to defend an old prediction. It's to adapt when the market changes.
The original charts, dates and levels are available in my FREE Telegram group. Scroll up and check the history.
No hindsight analysis. No pretending. Just charts, levels, strategy and patience.
I FOLLOW THE MARKET. I DON'T MARRY A PRICE TARGET.
— Crypto Daddy | LEVEL TO LEVEL.