$JCT Volume 8.7x Normal 👀 What Is Going On?
TL;DR: Outperforming Bitcoin by 427% this month; volume 8.7x its 30-day average. History leans down (5/15). Price 0.013408, daily RSI 44.
📊 Why it moved
1️⃣ Volume is 8.7x its 30-day average: real participation, not a thin-book wick.
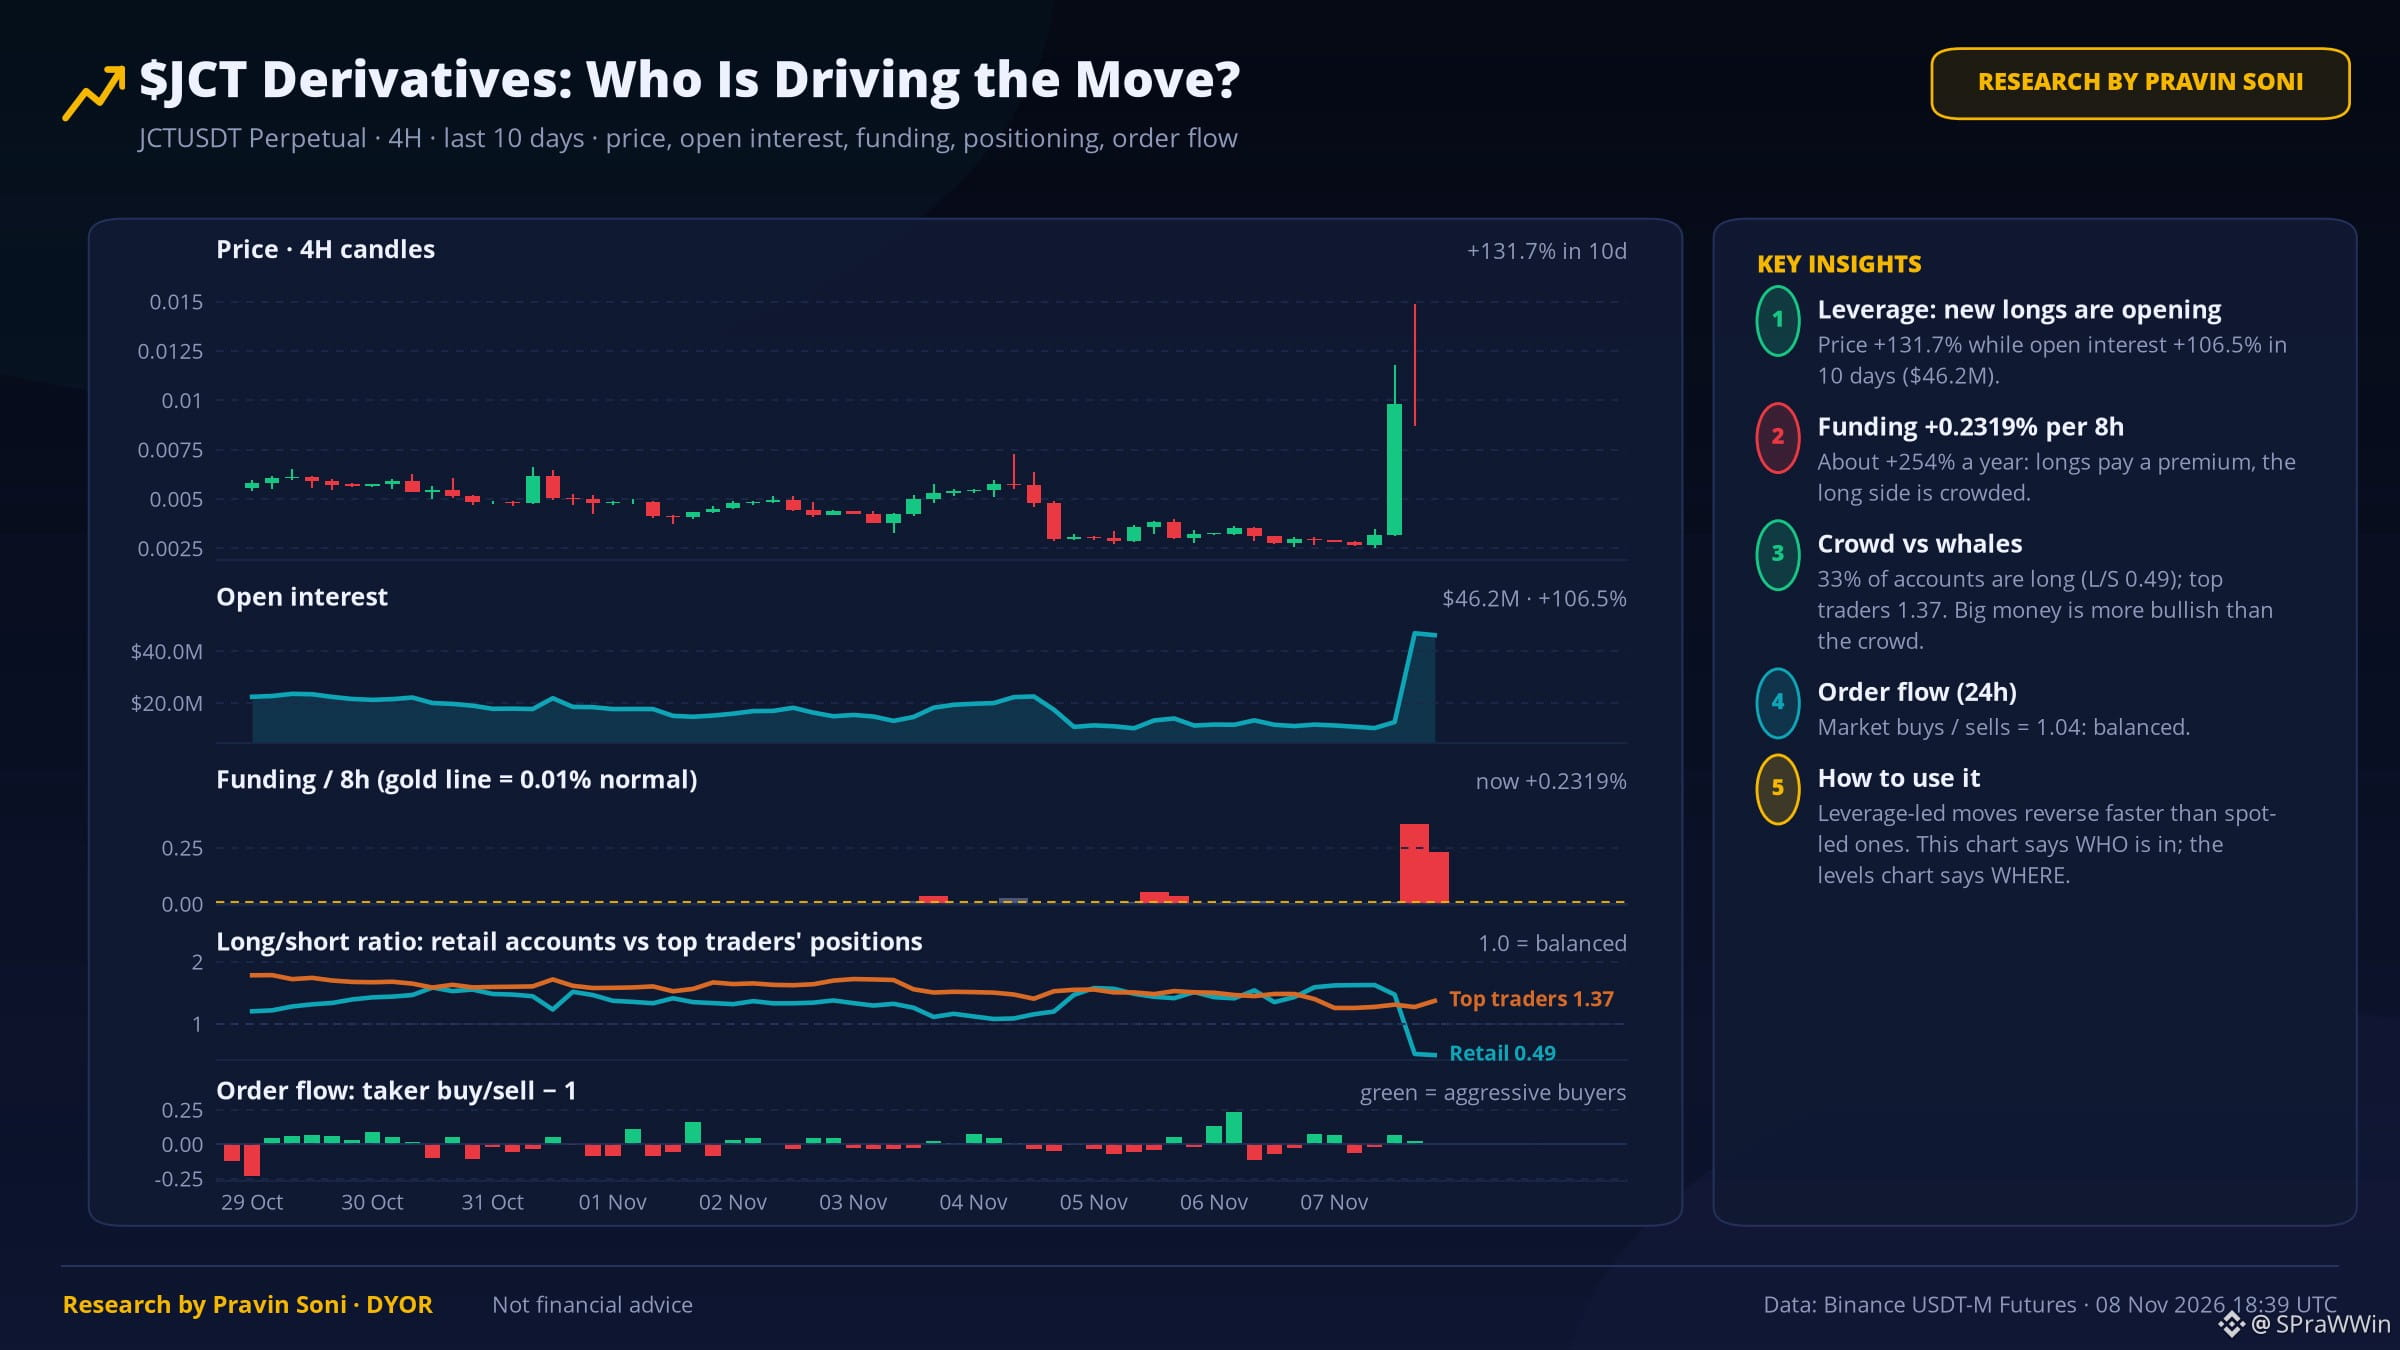
2️⃣ Open interest +441% with price up: new leveraged longs are driving it. Fuel now, flush risk if it stalls.
3️⃣ Funding +0.228%: longs are paying up, the long side is getting crowded.
4️⃣ No verified news catalyst in the last 48h, so this looks flow/technical driven.
⏪ Has this happened before?
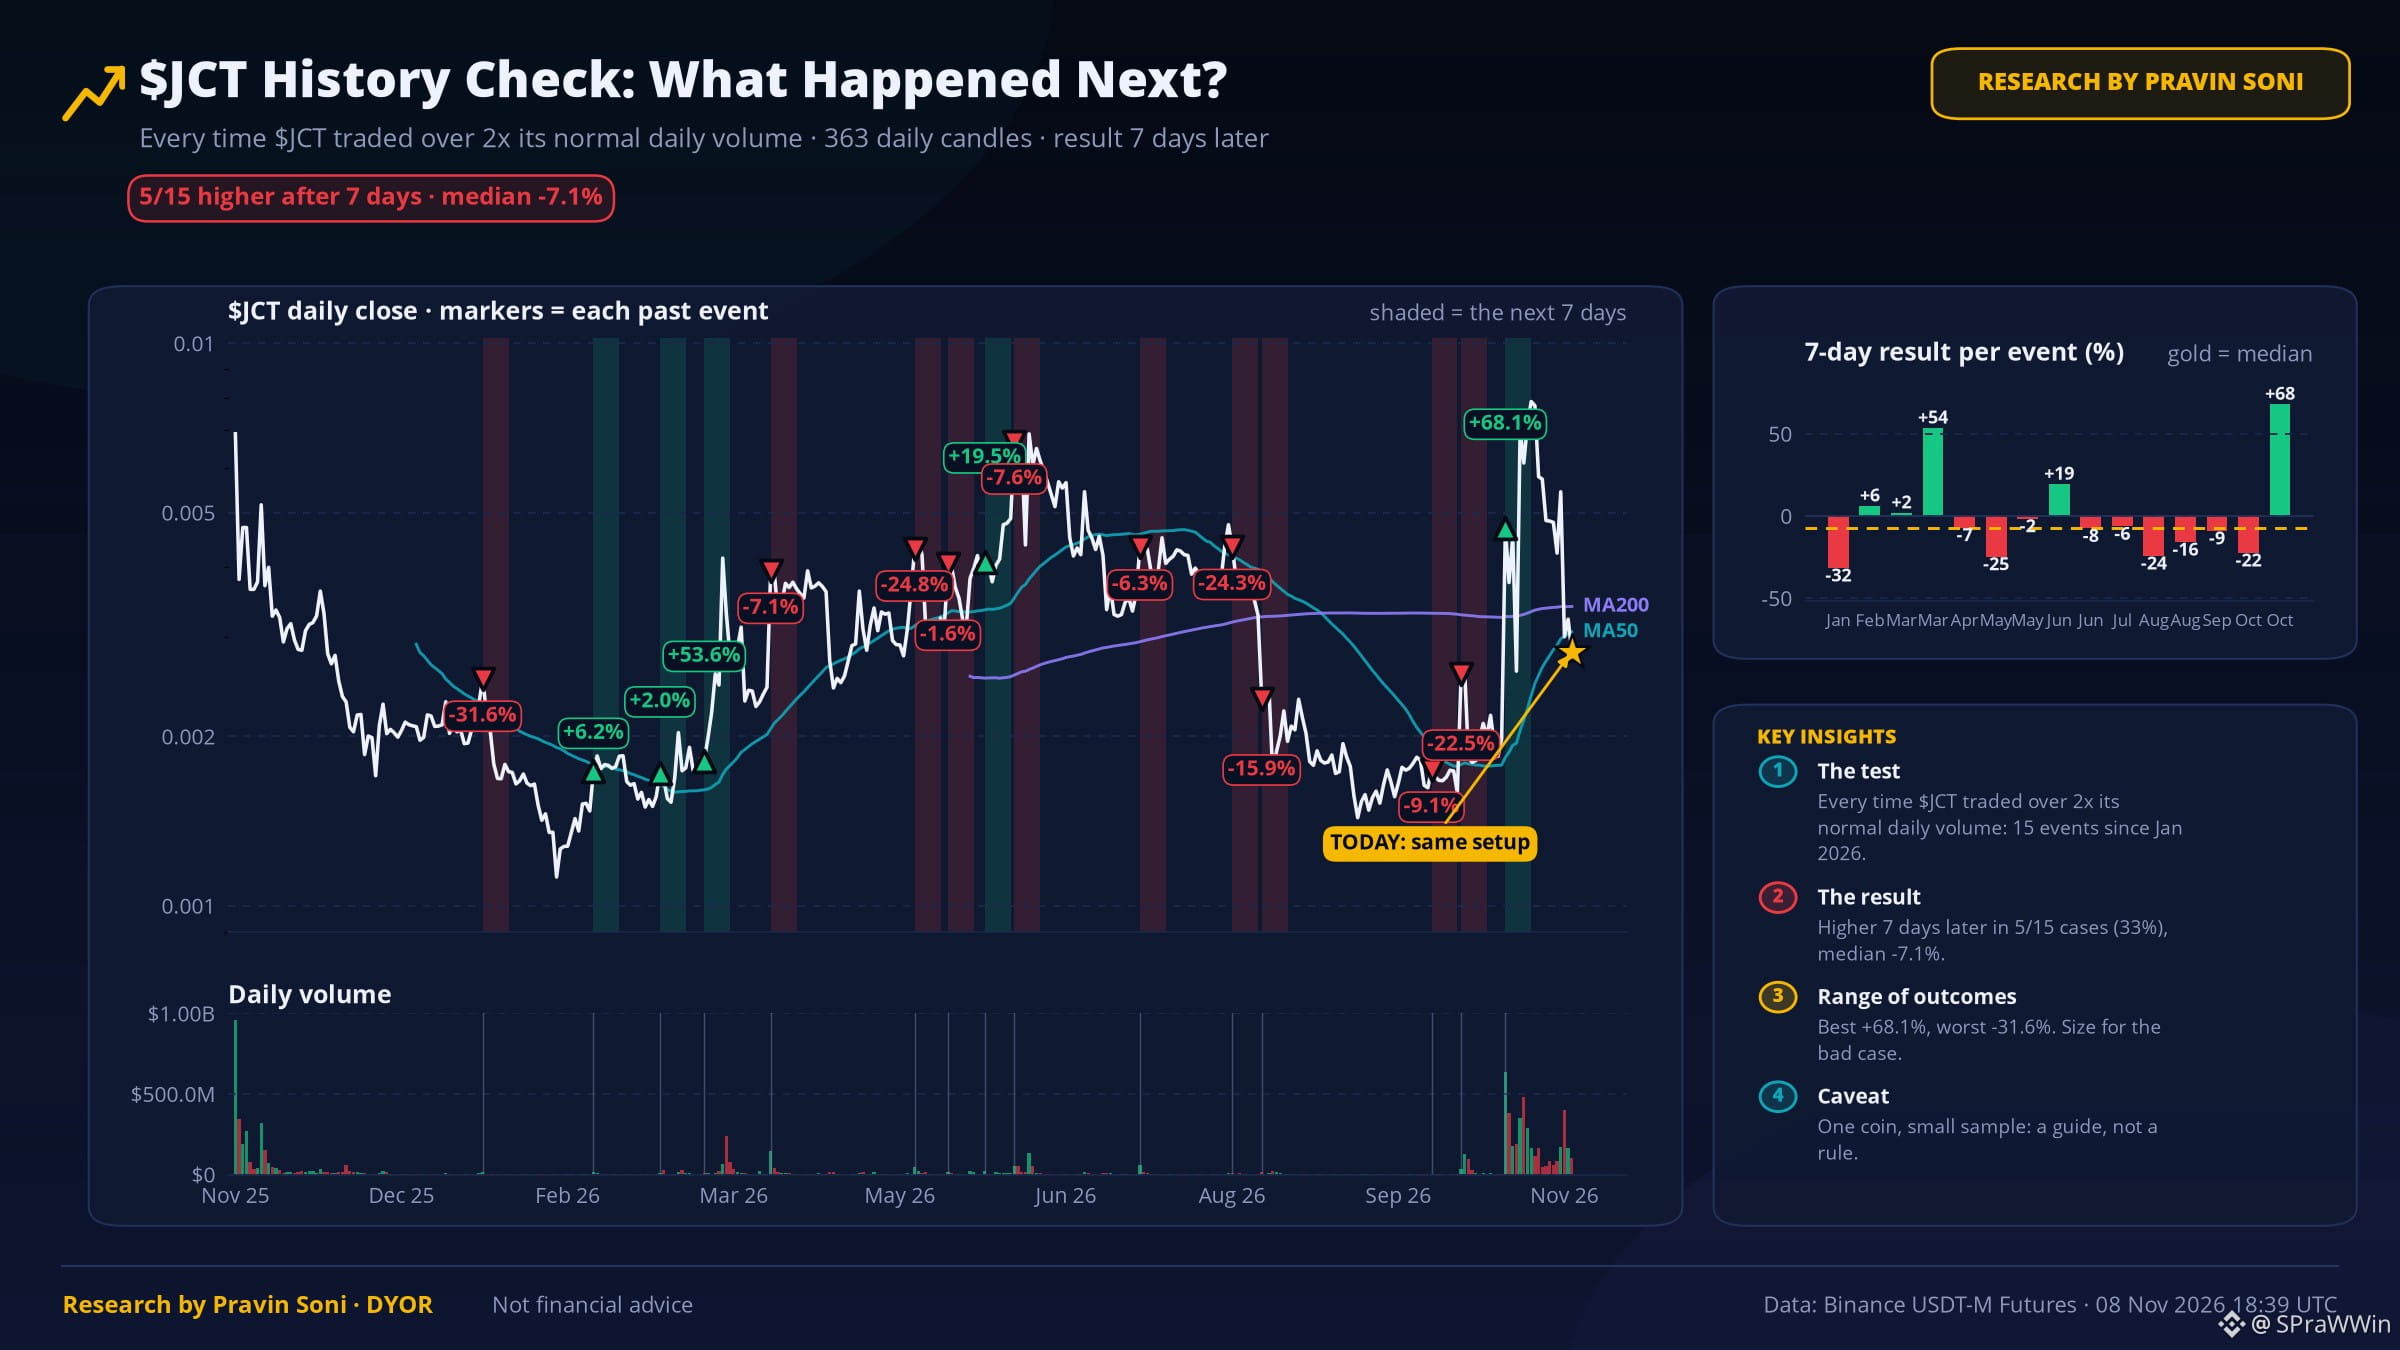
The last 15 times $JCT traded over 2x its normal daily volume, it was higher 7 days later in 5 of 15 cases (median -7.1%). Small sample, so a guide, not a rule.
🗺️ 7-day range map
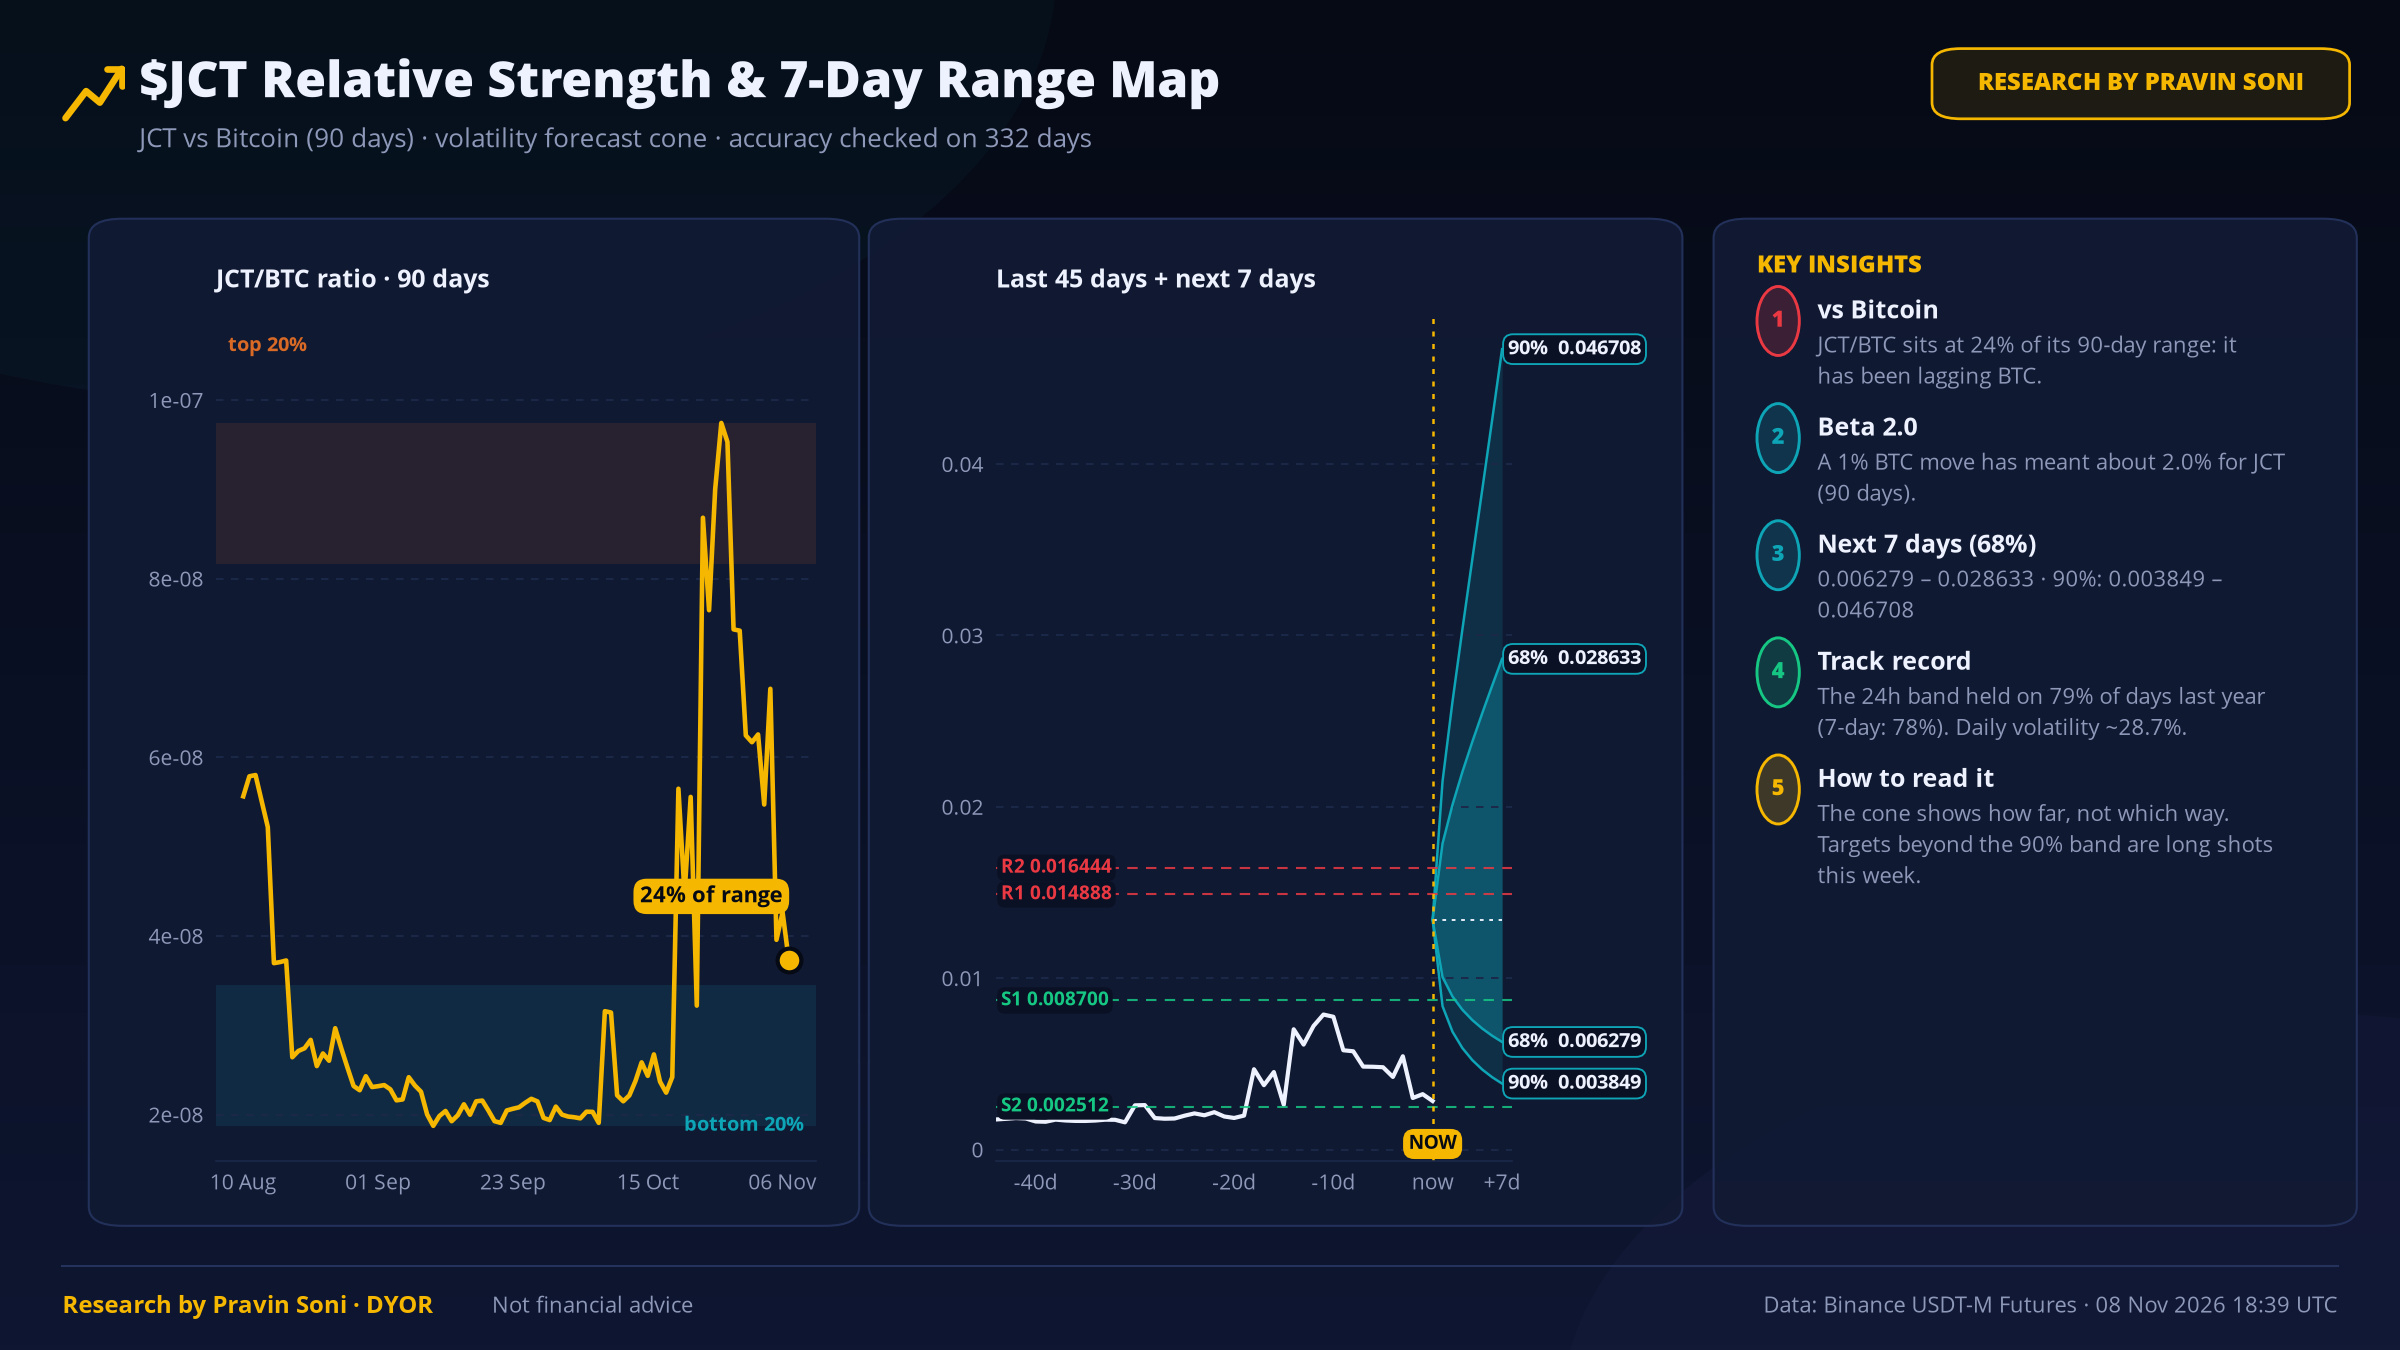
68% band: 0.006279 – 0.028633 · 90% band: 0.003849 – 0.046708
This band held on 79% of days last year. It shows how far, not which way.
vs $BTC: JCT/BTC sits at 24% of its 90-day range, beta 2.0.
🎯 Levels that matter
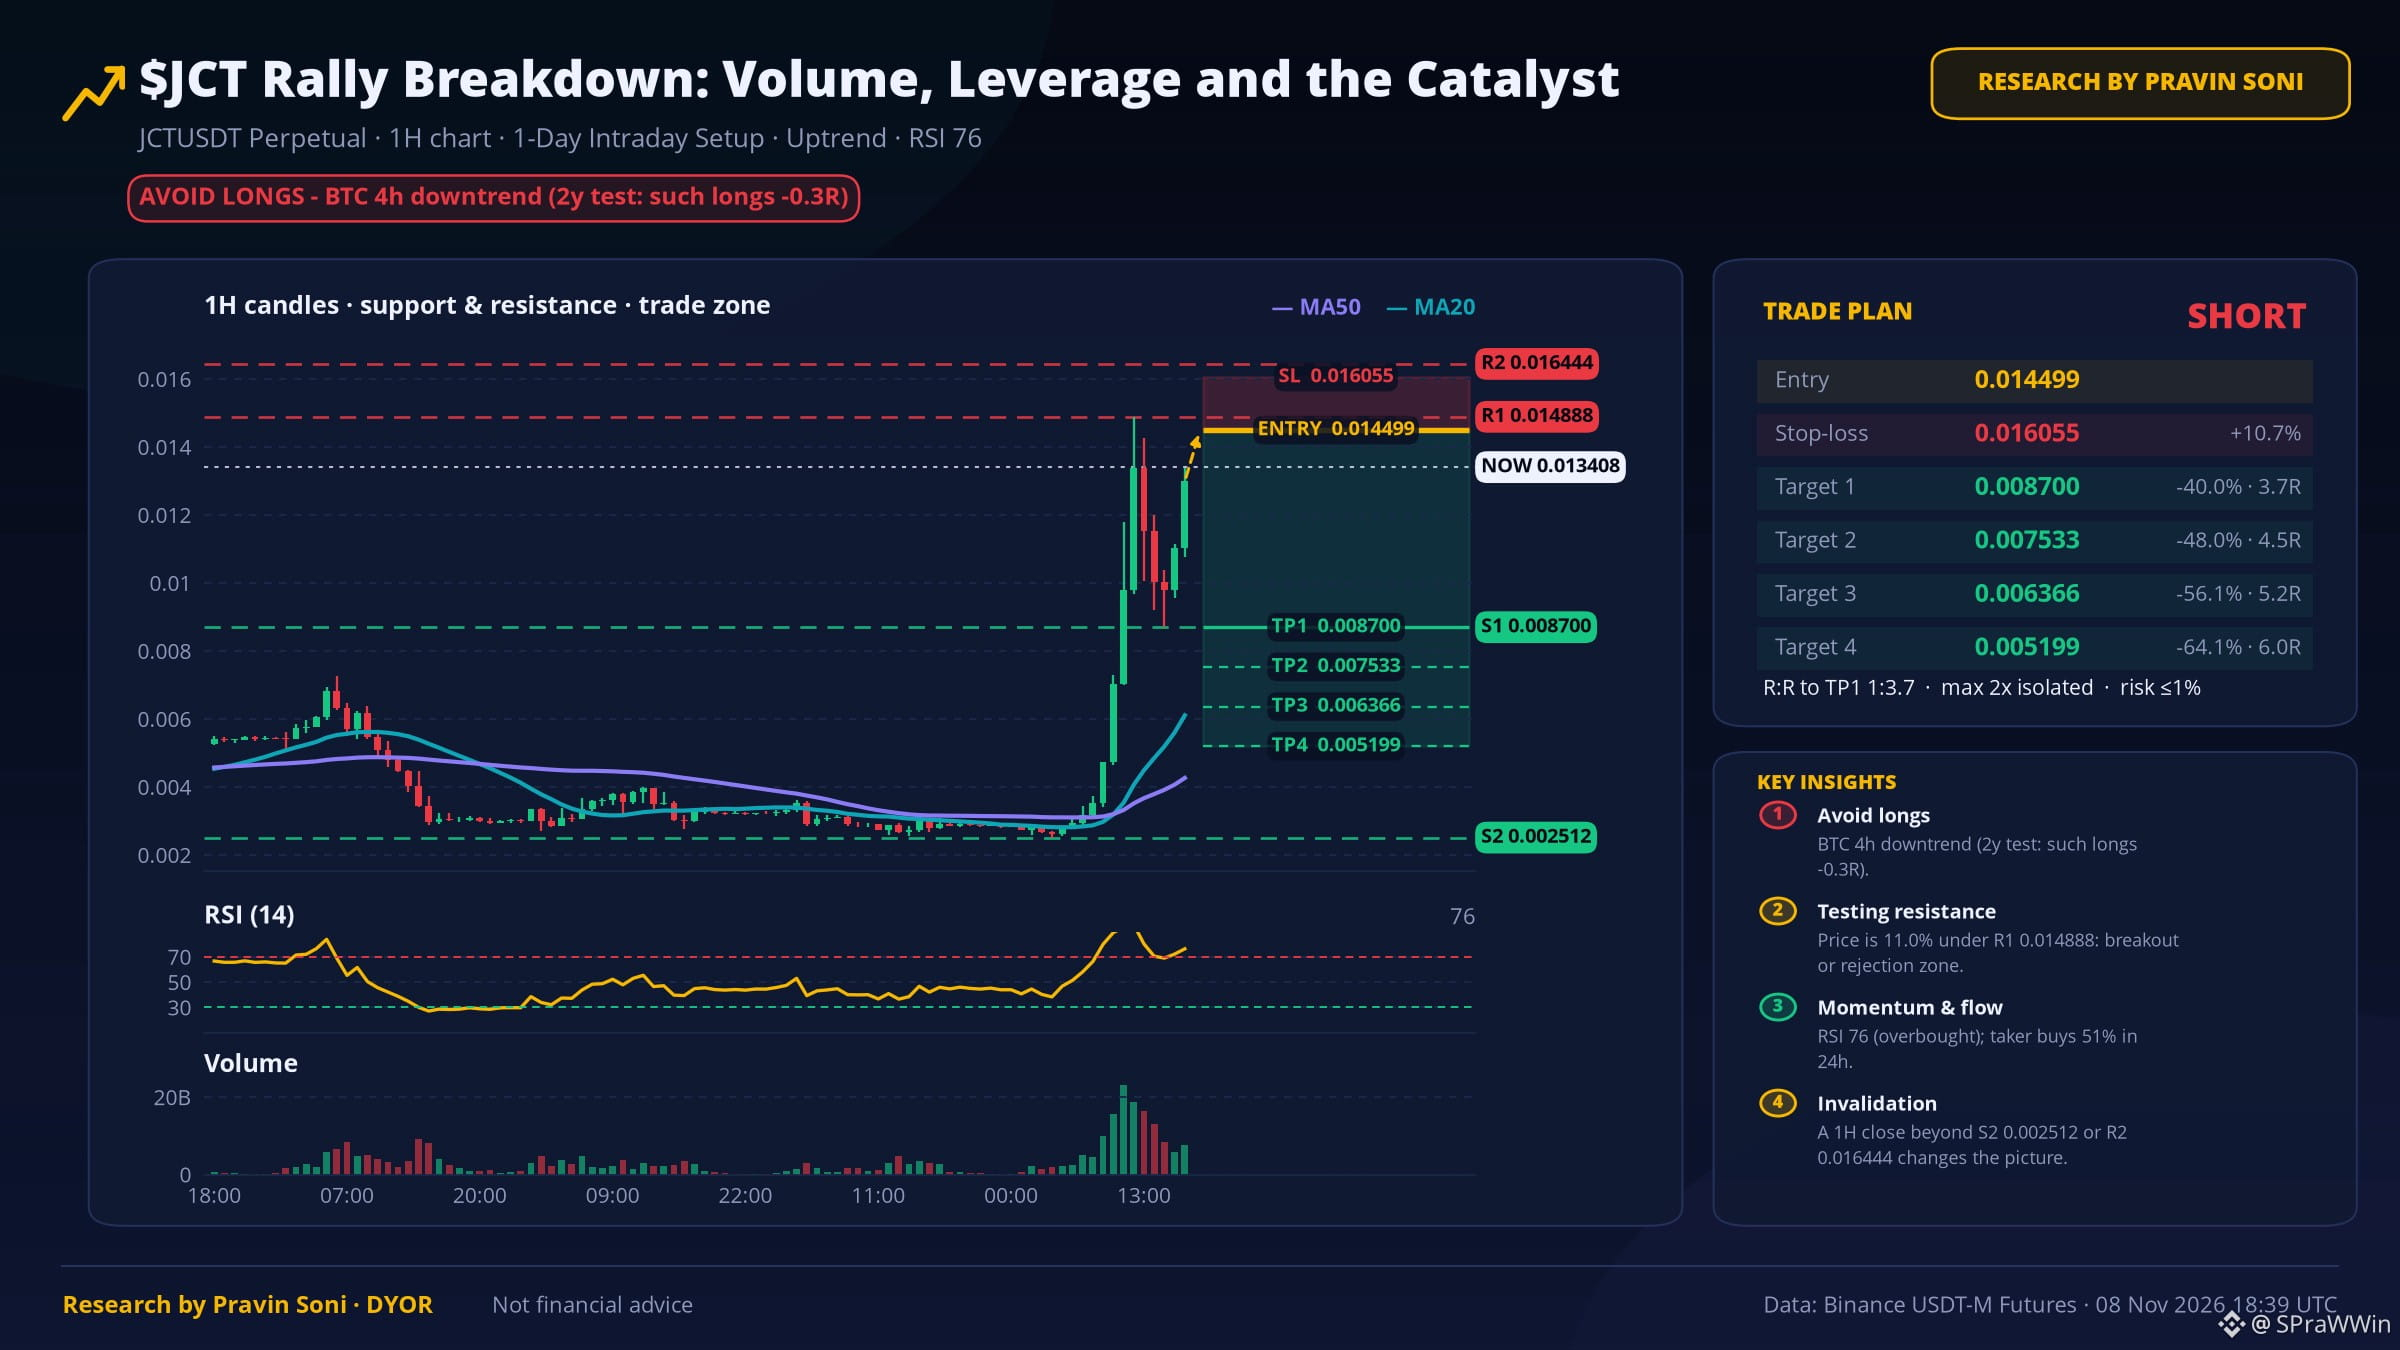
🟢 Bull case: daily close above 0.014888 → 0.016444
🔴 Bear case: daily close below 0.008700 → 0.002512
🧠 My read: No clear edge yet. Let price pick a side between 0.008700 and 0.014888 first.
💬 What's your read here: bullish, bearish or waiting?
Not financial advice · Data: Binance Futures
$JCT #JCT #TopGainers #CryptoAnalysis
⚠️ Research by Pravin Soni - DYOR
TL;DR: Outperforming Bitcoin by 427% this month; volume 8.7x its 30-day average. History leans down (5/15). Price 0.013408, daily RSI 44.
📊 Why it moved
1️⃣ Volume is 8.7x its 30-day average: real participation, not a thin-book wick.
2️⃣ Open interest +441% with price up: new leveraged longs are driving it. Fuel now, flush risk if it stalls.
3️⃣ Funding +0.228%: longs are paying up, the long side is getting crowded.
4️⃣ No verified news catalyst in the last 48h, so this looks flow/technical driven.
⏪ Has this happened before?
The last 15 times $JCT traded over 2x its normal daily volume, it was higher 7 days later in 5 of 15 cases (median -7.1%). Small sample, so a guide, not a rule.
🗺️ 7-day range map
68% band: 0.006279 – 0.028633 · 90% band: 0.003849 – 0.046708
This band held on 79% of days last year. It shows how far, not which way.
vs $BTC: JCT/BTC sits at 24% of its 90-day range, beta 2.0.
🎯 Levels that matter
🟢 Bull case: daily close above 0.014888 → 0.016444
🔴 Bear case: daily close below 0.008700 → 0.002512
🧠 My read: No clear edge yet. Let price pick a side between 0.008700 and 0.014888 first.
💬 What's your read here: bullish, bearish or waiting?
Not financial advice · Data: Binance Futures
$JCT #JCT #TopGainers #CryptoAnalysis
⚠️ Research by Pravin Soni - DYOR