


Can the future price of an asset be predicted simply by measuring how scarce it is?
In March 2019, a pseudonymous institutional investor named PlanB published an article titled "Modeling Bitcoin's Value with Scarcity." The paper introduced the Stock-to-Flow (S2F) model to the cryptocurrency world.
For years, traditional commodities like gold and silver used the Stock-to-Flow ratio to explain why precious metals held monetary value across centuries. PlanB applied that exact same mathematical lens to Bitcoin. The result was a bold hypothesis: because Bitcoin has an unchangeable issuance schedule that cuts new supply in half every four years, its price should follow a predictable upward path over time.
While the model became one of the most famous charts in Bitcoin history, it also sparked fierce debate among economists and statisticians. Here is an objective breakdown of how the Stock-to-Flow model works, how it measures scarcity, and where its real-world limitations lie.
The Basic Formula: What Are "Stock" and "Flow"?
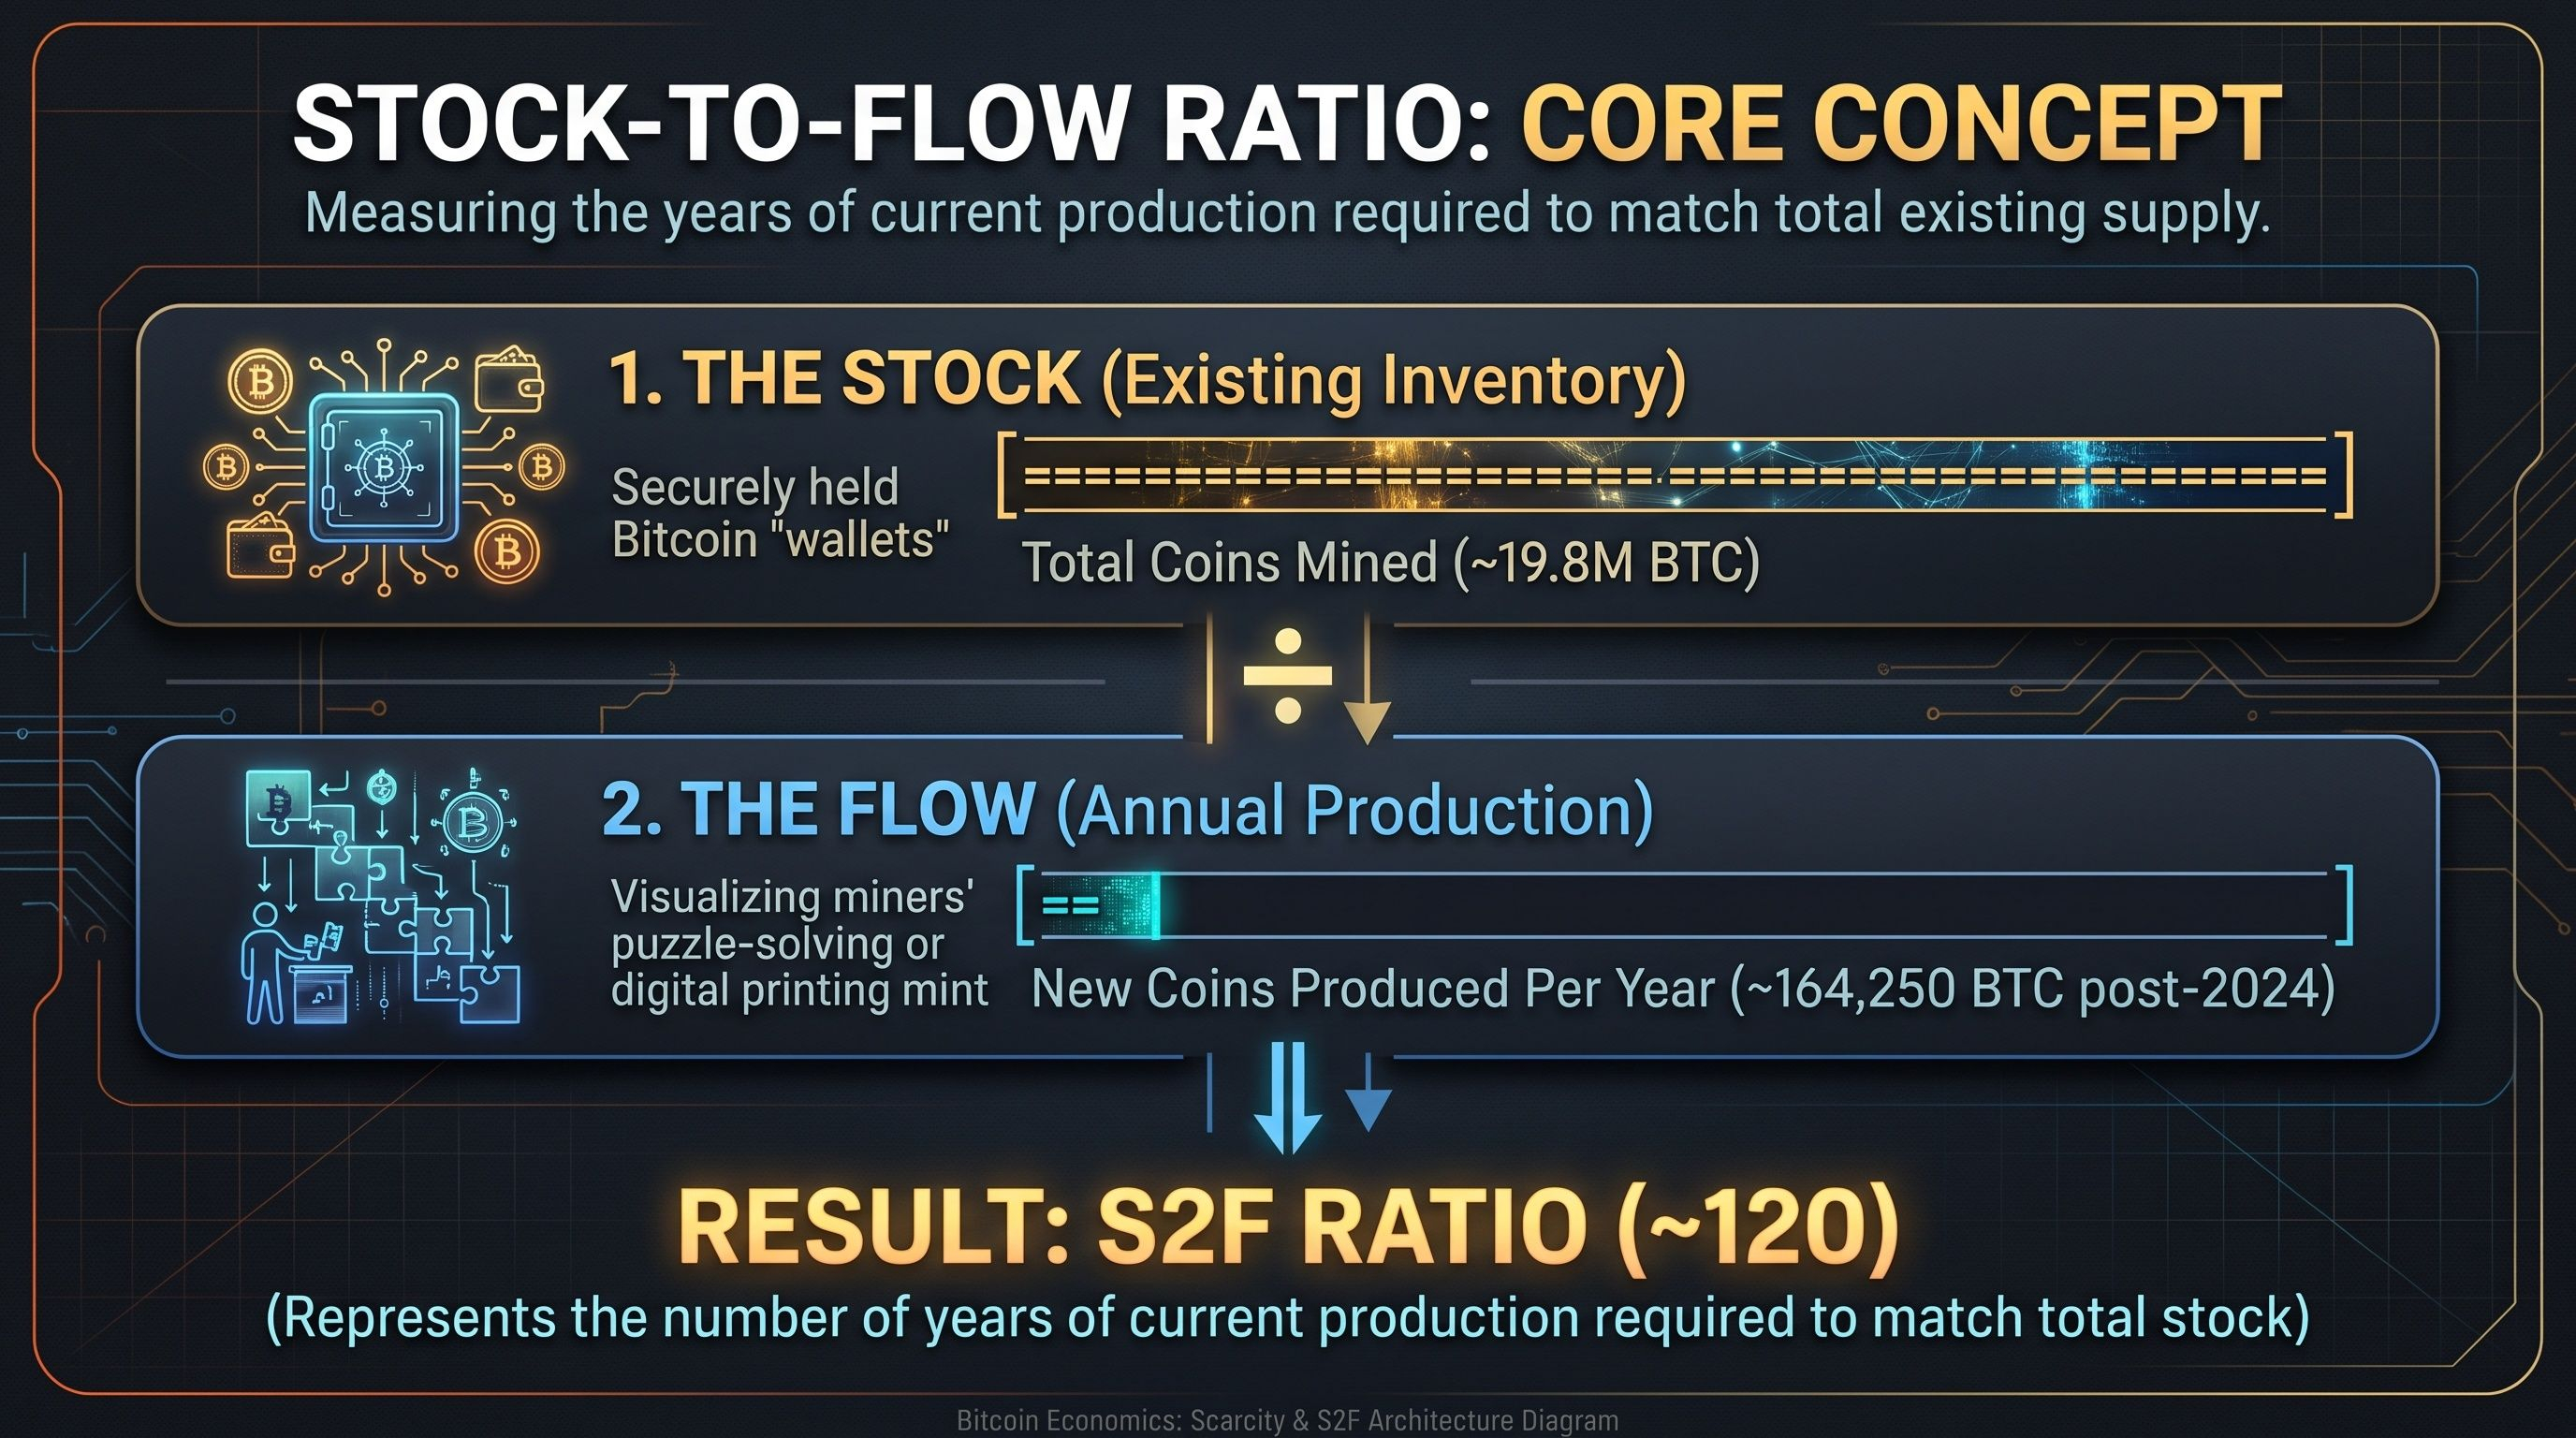
The Stock-to-Flow model is built on two simple financial variables:
Stock: The total existing supply of an asset that has already been extracted, produced, and held.
Flow: The amount of new supply produced or mined over a specific time period (typically one year).
$$\text{Stock-to-Flow Ratio} = \frac{\text{Stock}}{\text{Flow}}$$AAPLB
What Does the S2F Ratio Actually Tell You?
The resulting number represents the number of years of current production required to recreate the entire existing supply.
A Low S2F Ratio (Consumable Commodities): Goods like wheat, oil, and zinc have low S2F ratios (often near 1 to 2). Almost everything produced each year is consumed, burned, or used up. If demand spikes, suppliers increase drilling or farming, quickly flooding the market and depressing prices.
A High S2F Ratio (Monetary Store of Value): Commodities like physical gold have high S2F ratios. Because gold is rarely destroyed or consumed industrially, nearly every ounce ever mined still sits in vaults and jewelry boxes. If the price of gold doubles tomorrow, gold miners cannot suddenly double the Earth's gold reserves; annual production barely moves the needle against the massive existing stock.
In economics, this property is called unforgeable costliness or supply inelasticity. The higher the S2F ratio, the harder it is to dilute the existing wealth of holders.
How Bitcoin’s S2F Compares to Gold and Silver
Before Bitcoin, physical gold sat uncontested as the asset with the highest Stock-to-Flow ratio on Earth.
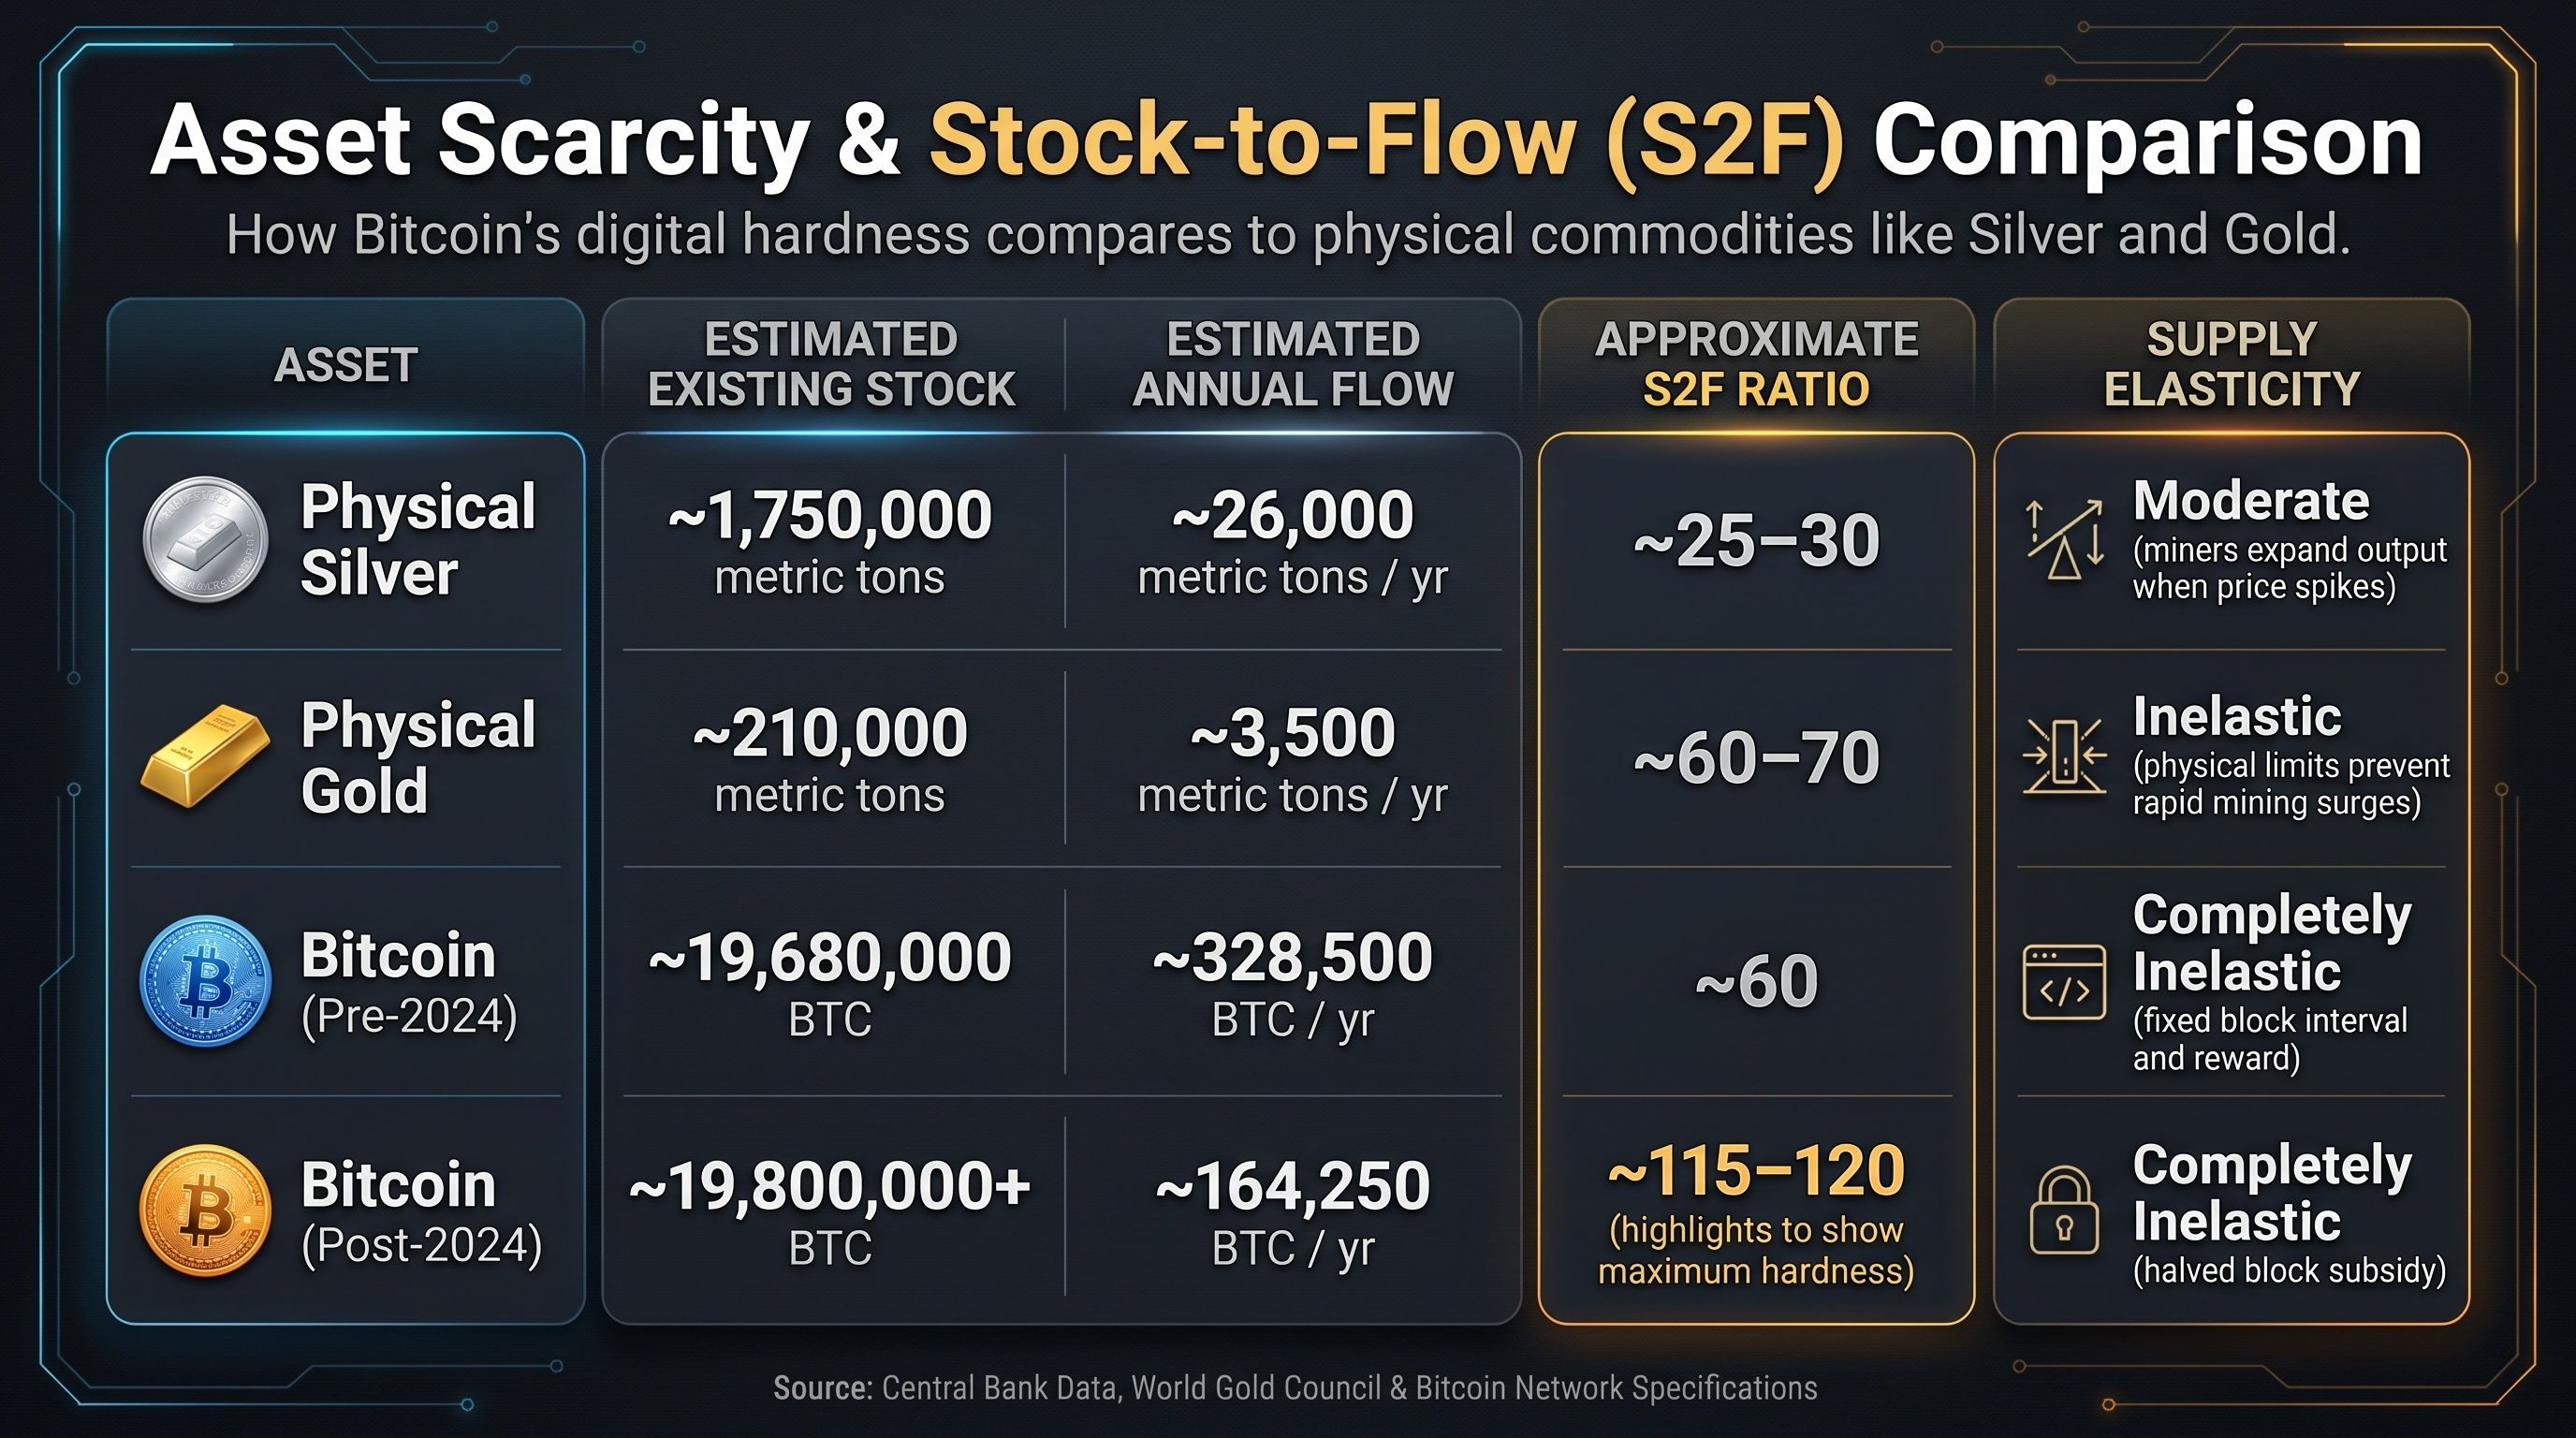
Physical Silver: Around 1.5 to 2 million metric tons of silver exist above ground, with roughly 25,000 to 28,000 tons mined annually. This gives silver an estimated S2F ratio around 20 to 30.
Physical Gold: The World Gold Council estimates historical above-ground gold stocks at roughly 210,000 metric tons, with annual mine production averaging around 3,000 to 3,500 metric tons. This yields an S2F ratio of roughly 60 to 70. In plain terms: it would take roughly 60 years of non-stop gold mining with zero consumption to double the world's gold hoard.
Bitcoin (Pre-April 2024): With miners producing ~900 BTC per day (~328,500 BTC per year) against a supply of ~19.6 million coins, Bitcoin's S2F ratio was roughly 56 to 60—nearly matching gold.
Bitcoin (Post-April 2024 Halving): When the block reward dropped to 3.125 BTC per block, annual production fell to roughly 164,250 BTC per year. Against a circulating supply of over 19.8 million BTC, Bitcoin's S2F ratio climbed to over 110 to 120.
Mathematically, the 2024 halving made Bitcoin roughly twice as scarce in production terms as physical gold.
How the Model Predicts Bitcoin's Price
PlanB took this physical commodity ratio and plotted it against historical Bitcoin market data using logarithmic scales and a statistical technique known as linear regression.
The formula found a strong historical correlation: every time Bitcoin's halving event occurred, cutting the flow in half and doubling the S2F ratio, the market capitalization of Bitcoin subsequently stepped up by an order of magnitude.
On the famous Stock-to-Flow chart:
The Step Line: Represents the model's theoretical price trajectory. It stays flat for four years, takes a sharp vertical step upward at each halving, and then stays flat again until the next cycle.
The Colored Dots: Represent Bitcoin's actual daily spot price, color-coded by the number of months remaining until the next halving.
During the cycles following the 2012 and 2016 halvings, Bitcoin's market price oscillated tightly around this model line, turning the S2F chart into one of the most widely shared graphics in retail and institutional crypto trading.
The Major Flaws and Criticisms of the S2F Model
Despite its initial popularity, many economists, quantitative traders, and researchers have pointed out critical flaws in relying on Stock-to-Flow as a price predictor.
1. The Demand Blind Spot
Price is determined by the intersection of supply AND demand.
The Stock-to-Flow model measures supply with mathematical precision, but it completely ignores the demand side of the equation:
If a digital token has a fixed supply of 100 coins and only 1 coin is minted per century, its S2F ratio would be an astronomical 10,000. But if nobody wants the token, its price will still be $0.
A high S2F ratio only matters if people actively desire to hold the asset as a store of value. Changes in macroeconomic liquidity, interest rates, capital controls, and investor sentiment dictate price just as much as coin production.
2. The Problem of Mathematical Infinity
Because Bitcoin has a hard cap of 21 million coins, the block subsidy will eventually reach zero around the year 2140.
As annual production (Flow) approaches zero:
$$\lim_{\text{Flow} \to 0} \frac{\text{Stock}}{\text{Flow}} = \infty$$
Under the model's pure mathematical formula, dividing by zero forces the S2F ratio to infinity, which projects an infinite Bitcoin price and infinite market capitalization. Because the entire world contains a finite amount of wealth, the model must mathematically break down as block subsidies wind down.
3. Spurious Correlation in Time Series
Econometricians and financial researchers have criticized the statistical foundation of the model, arguing that it suffers from spurious correlation.
In statistics, if you plot two independent datasets that both trend upward over time—such as world population and the cumulative price of computing power—standard regression models will claim a high statistical correlation ($R^2$), even though one variable does not cause the other. While PlanB argued that Bitcoin's price and S2F were cointegrated, subsequent analyses by independent researchers showed that the relationship struggled to maintain cointegration during prolonged bear markets and macroeconomic shifts.
Asset Scarcity (S2F) Across Markets
Frequently Asked Questions
Who created the Bitcoin Stock-to-Flow model?
The model was adapted for Bitcoin by PlanB, a pseudonymous Dutch quantitative analyst with a background in institutional financial markets, who published the initial paper in March 2019 under the Twitter handle @100trillionUSD.
Did the Stock-to-Flow model fail in the 2021–2022 cycle?
The original model projected that Bitcoin's average cycle price between 2020 and 2024 would hover around $100,000. While Bitcoin reached an all-time high of approximately $69,000 in late 2021, the subsequent drop to below $16,000 in 2022 broke below the lower bounds of the original model's standard deviation bands, leading many analysts to argue the predictive model had failed.
What is the difference between S2F and S2FX?
In 2020, PlanB introduced the S2FX (Stock-to-Flow Cross Asset Model). Instead of tracking Bitcoin solely across time, S2FX treated Bitcoin as transitioning through different phases (from "Proof of Concept" to "Payments" to "E-Gold" to "Financial Asset") and compared it directly against gold and silver clusters to project a higher valuation band.
Can a government increase Bitcoin's Flow to lower its S2F ratio?
No. Unlike fiat currencies—where governments and central banks can expand issuance by printing new money or issuing debt—Bitcoin's issuance schedule is enforced by thousands of independent validator nodes worldwide. No single government, corporation, or mining pool has the authority to alter the hardcoded block reward schedule.