

Bitcoin (BTC/USDT)
$75,814.3
-0.07% shown in screenshot
Binance USDⓈ-M Perpetual
1. Market Overview
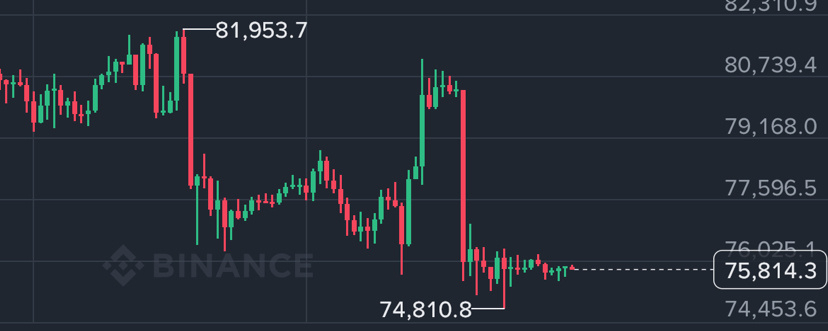
Bitcoin is showing a bearish structure after experiencing a significant decline from the $81,953 region.
The chart shows three important developments:
BTC previously reached approximately $81,953.7.
Strong selling pressure pushed the price down towards $74,810.8.
Buyers attempted to recover, but another sharp rejection brought the price back towards $75,814.
Currently, BTC is consolidating around $75,800, indicating uncertainty between buyers and sellers.
2. Important Support and Resistance Levels
Price level
Technical importance
$81,953
Major resistance
$80,739
Strong resistance
$79,168
Resistance
$77,596
Intermediate resistance
$76,025
Immediate resistance
$75,814
Current price
$74,810
Major visible support
3. Bullish Scenario
For Bitcoin to demonstrate a stronger recovery:
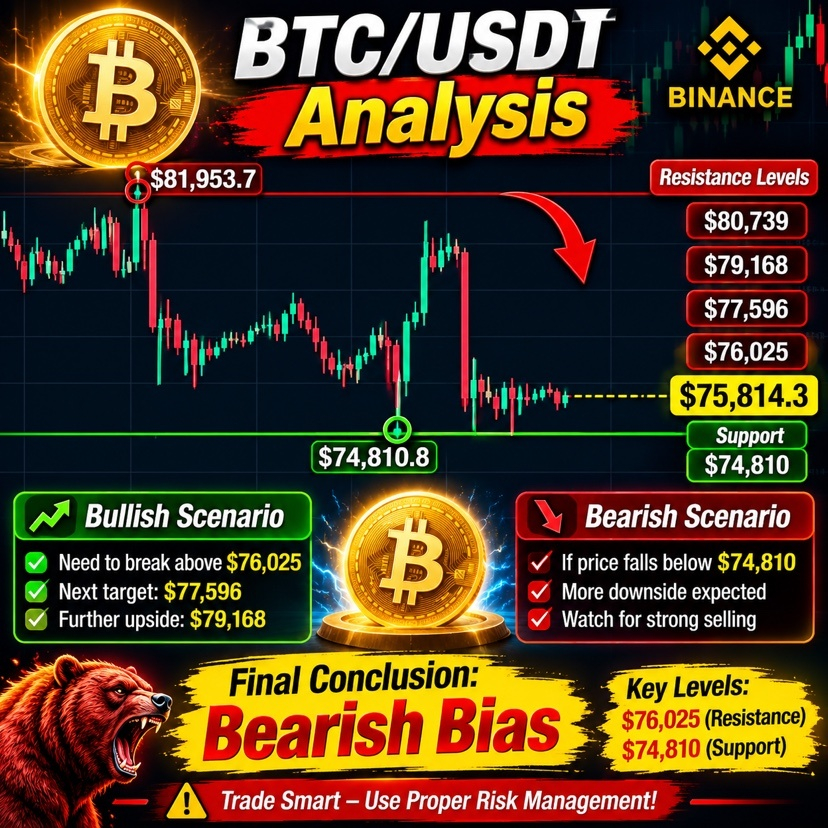
BTC needs to regain the $76,025 area.
Sustained buying could bring $77,596 into focus.
A stronger recovery could potentially test $79,168.
However, a short-term bounce alone would not confirm a bullish trend reversal.
4. Bearish Scenario
The bearish scenario remains important because of the previous sharp sell-off.
If BTC loses its current consolidation:
Selling pressure could increase.
The $74,810 support becomes important.
A decisive break below this level would indicate further weakness.
These are conditional scenarios, not confirmed price predictions.
5. Order Book Analysis
The visible order book provides some interesting information:
A sell order of approximately 19.646 BTC appears around $75,814.4.
A buy order of approximately 3.212 BTC appears around $75,814.3.
This indicates visible selling liquidity immediately above the displayed price. However, order-book liquidity can disappear or change quickly, so it cannot independently predict direction.
6. Overall Market Outlook
My technical assessment
Bearish bias
BTC has experienced a substantial decline and is currently consolidating near its recent lows.
Key levels to watch:
$76,025 – Recovery confirmation area.
$77,596 – Next important resistance.
$74,810 – Critical visible support.
A sustained move above resistance or below support would provide better directional evidence.
7. Final Conclusion
Bitcoin is currently in a weak technical position. The previous selling pressure suggests that sellers have had the upper hand. Buyers need to demonstrate stronger momentum before a meaningful recovery can be established.
Important: Your screenshot shows 20x leverage selected. Futures leverage can magnify losses significantly. This analysis is educational, not a recommendation to open a position.
One question: Can you share the BTC 15-minute or 1-hour chart? That would help assess the current trend, momentum, and support/resistance levels more accurately.
#JobsReportRaisesHikeOdds #BTC突破7万大关
