🚀 USDC/USDT: Market Structure, Liquidity & Peg Stability Analysis
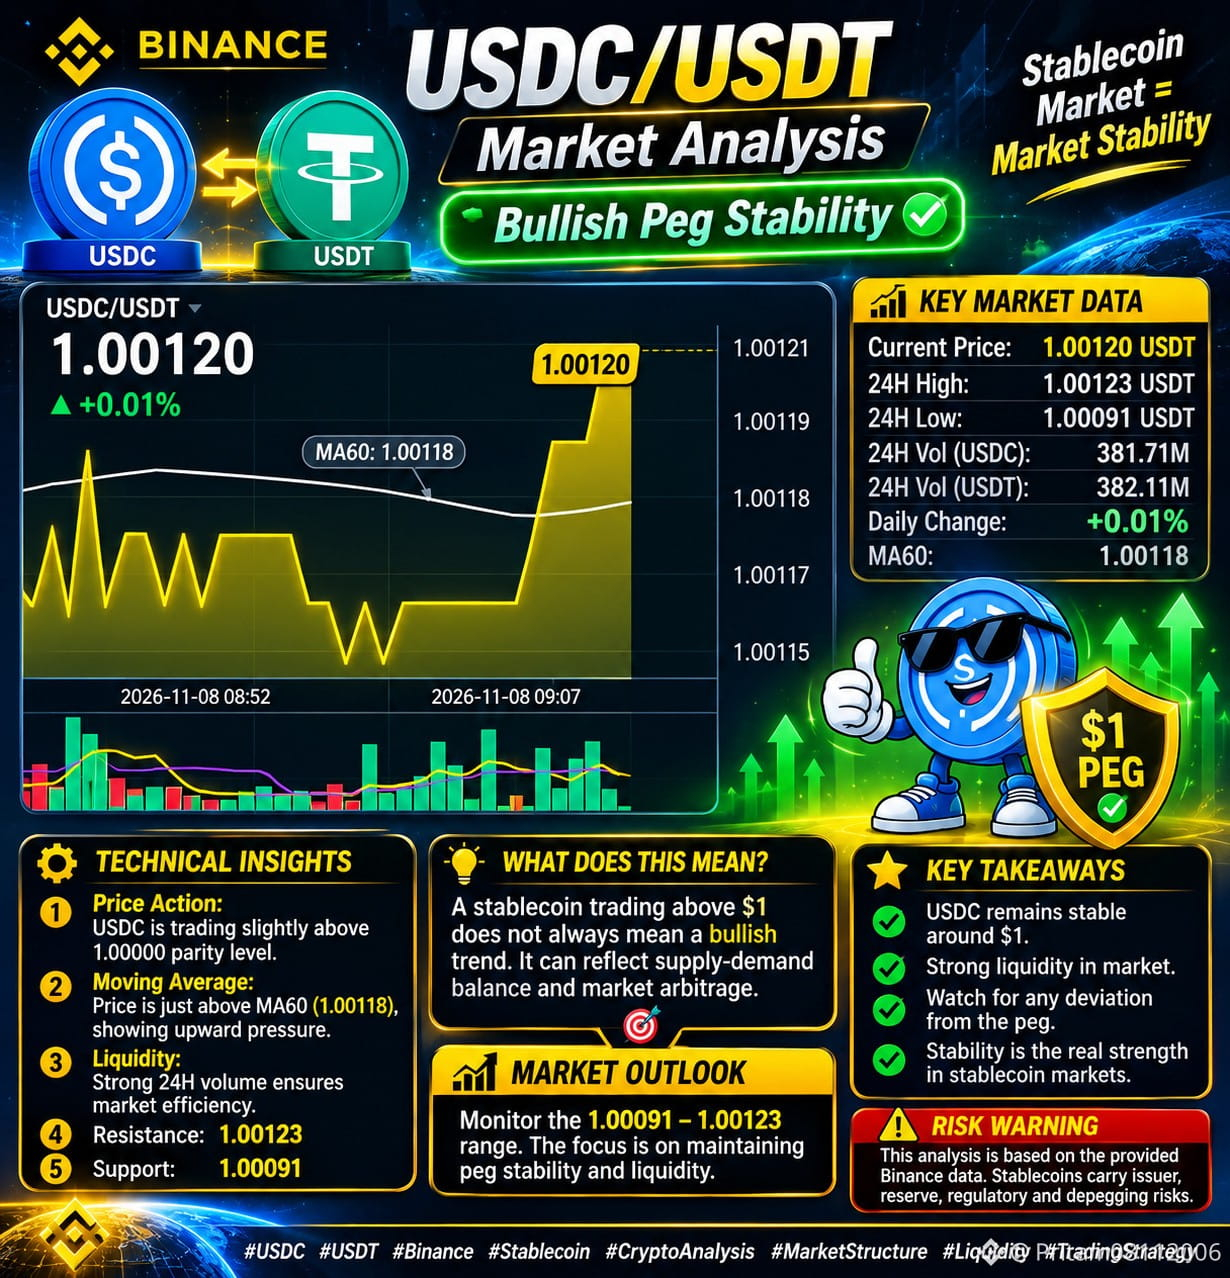
The USDC/USDT trading pair is currently demonstrating a relatively stable price structure, with USDC trading at approximately 1.00120 USDT according to the provided Binance snapshot.
📊 KEY MARKET DATA
Current Price: 1.00120 USDT
24H High: 1.00123 USDT
24H Low: 1.00091 USDT
24H Trading Volume: 381.71M USDC
USDT Volume: 382.11M
Daily Performance: +0.02%
MA60: 1.00118
📈 TECHNICAL MARKET STRUCTURE
Price Action: USDC is trading slightly above the 1.00000 parity level, indicating a modest premium against USDT.
Moving Average: The current price is positioned marginally above the MA60 at 1.00118, suggesting short-term upward price pressure.
Liquidity Analysis: The reported 24-hour trading volume indicates substantial market activity. Consistent liquidity is important for maintaining efficient stablecoin conversions.
Resistance Zone: 1.00123 represents the visible 24-hour high and a short-term reference resistance.
Support Zone: 1.00091 is the visible 24-hour low and an important reference support level.
🔍 WHAT DOES THIS MEAN?
A stablecoin trading above $1 does not automatically indicate a bullish investment opportunity. Small deviations can reflect temporary supply-demand imbalances, liquidity conditions, and market arbitrage activity.
🎯 MARKET OUTLOOK
The immediate focus remains on whether USDC maintains its narrow trading range around the $1 parity level. Traders should monitor liquidity, trading volume, and any significant deviation from the peg.
💡 PROFESSIONAL INSIGHT: In stablecoin markets, price stability and liquidity are generally more important than conventional bullish or bearish momentum.
⚠️ This analysis is based on the provided Binance screenshot, not a live market feed. Stablecoins also carry issuer, reserve, regulatory, and depegging risks.
#USDC #USDT #Binance #Stablecoin #CryptoAnalysis #MarketStructure #Liquidity #TradingStrategy
The USDC/USDT trading pair is currently demonstrating a relatively stable price structure, with USDC trading at approximately 1.00120 USDT according to the provided Binance snapshot.
📊 KEY MARKET DATA
Current Price: 1.00120 USDT
24H High: 1.00123 USDT
24H Low: 1.00091 USDT
24H Trading Volume: 381.71M USDC
USDT Volume: 382.11M
Daily Performance: +0.02%
MA60: 1.00118
📈 TECHNICAL MARKET STRUCTURE
Price Action: USDC is trading slightly above the 1.00000 parity level, indicating a modest premium against USDT.
Moving Average: The current price is positioned marginally above the MA60 at 1.00118, suggesting short-term upward price pressure.
Liquidity Analysis: The reported 24-hour trading volume indicates substantial market activity. Consistent liquidity is important for maintaining efficient stablecoin conversions.
Resistance Zone: 1.00123 represents the visible 24-hour high and a short-term reference resistance.
Support Zone: 1.00091 is the visible 24-hour low and an important reference support level.
🔍 WHAT DOES THIS MEAN?
A stablecoin trading above $1 does not automatically indicate a bullish investment opportunity. Small deviations can reflect temporary supply-demand imbalances, liquidity conditions, and market arbitrage activity.
🎯 MARKET OUTLOOK
The immediate focus remains on whether USDC maintains its narrow trading range around the $1 parity level. Traders should monitor liquidity, trading volume, and any significant deviation from the peg.
💡 PROFESSIONAL INSIGHT: In stablecoin markets, price stability and liquidity are generally more important than conventional bullish or bearish momentum.
⚠️ This analysis is based on the provided Binance screenshot, not a live market feed. Stablecoins also carry issuer, reserve, regulatory, and depegging risks.
#USDC #USDT #Binance #Stablecoin #CryptoAnalysis #MarketStructure #Liquidity #TradingStrategy