
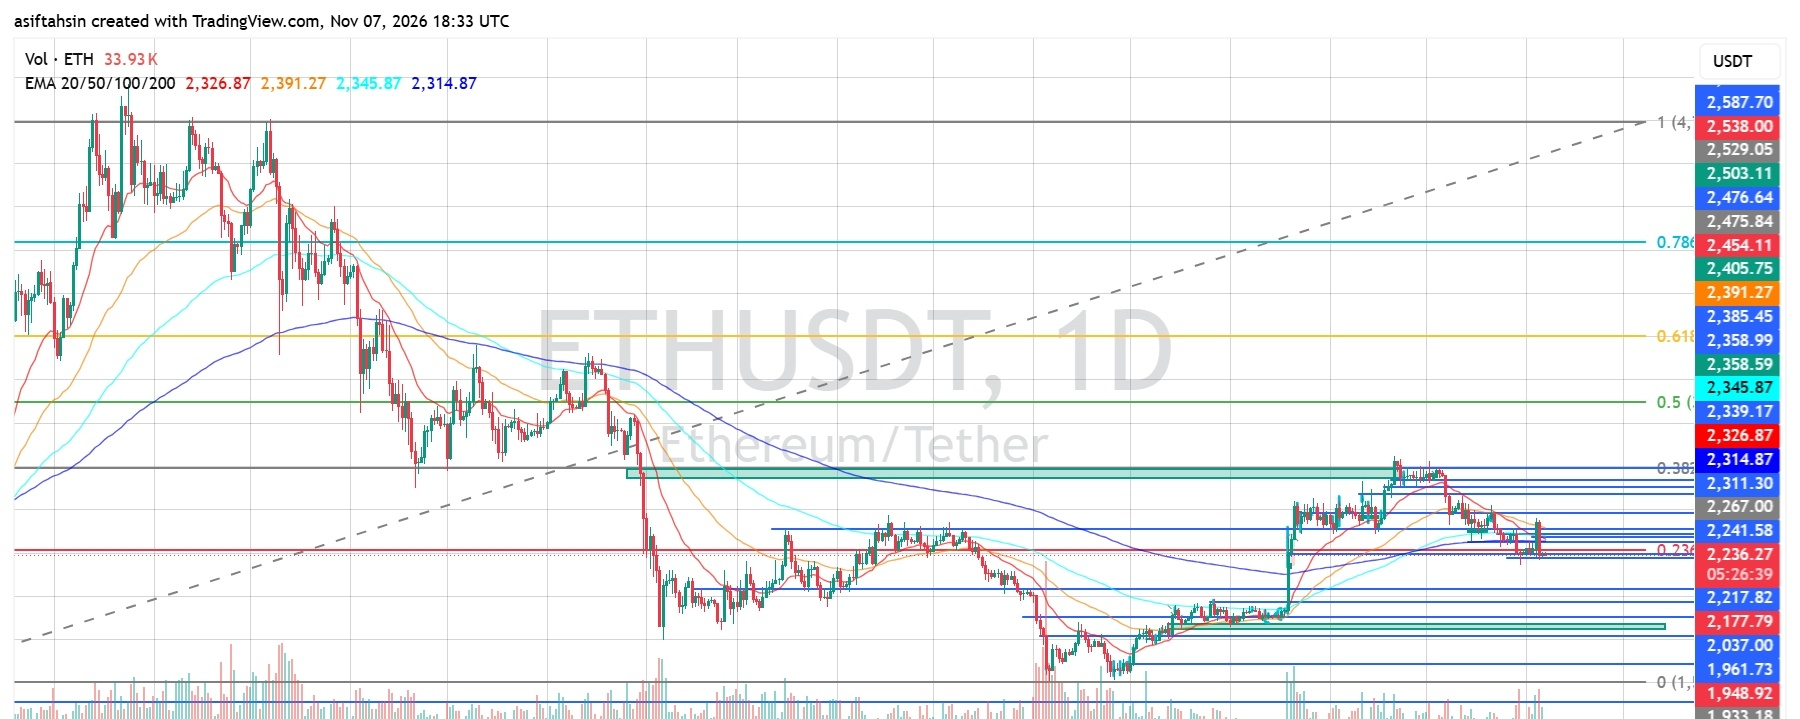

Ethereum remains under pressure on the daily timeframe after failing to sustain its recovery above the $2,300–$2,400 region. Price is currently trading around $2,236, below all four major EMAs, keeping the short-term structure cautious.
The key question is whether buyers can defend the $2,217–$2,177 support area or whether ETH will extend its correction toward lower demand zones.
1. EMA Structure
Current EMA levels:
- EMA 20: $2,326.87
- EMA 50: $2,391.27
- EMA 100: $2,345.87
- EMA 200: $2,314.87
ETH is trading below all four moving averages. The EMA structure indicates that sellers currently have the advantage.
The $2,314–$2,346 region is the first major resistance cluster. A sustained move above this zone would be an important sign of recovery. The EMA 50 near $2,391 remains a higher resistance level.
2. Fibonacci Levels
Key Fibonacci retracement levels:
- 0: $1,933.18
- 0.236: $2,241.58
- 0.382: $2,314.87
- 0.5: $2,358.59
- 0.618: $2,391.27
- 0.786: $2,503.11
- 1.0: $2,729.68
ETH is trading around the 0.236 Fibonacci region. Reclaiming $2,241.58 and holding above it could help buyers regain short-term momentum.
3. Market Structure & Liquidity
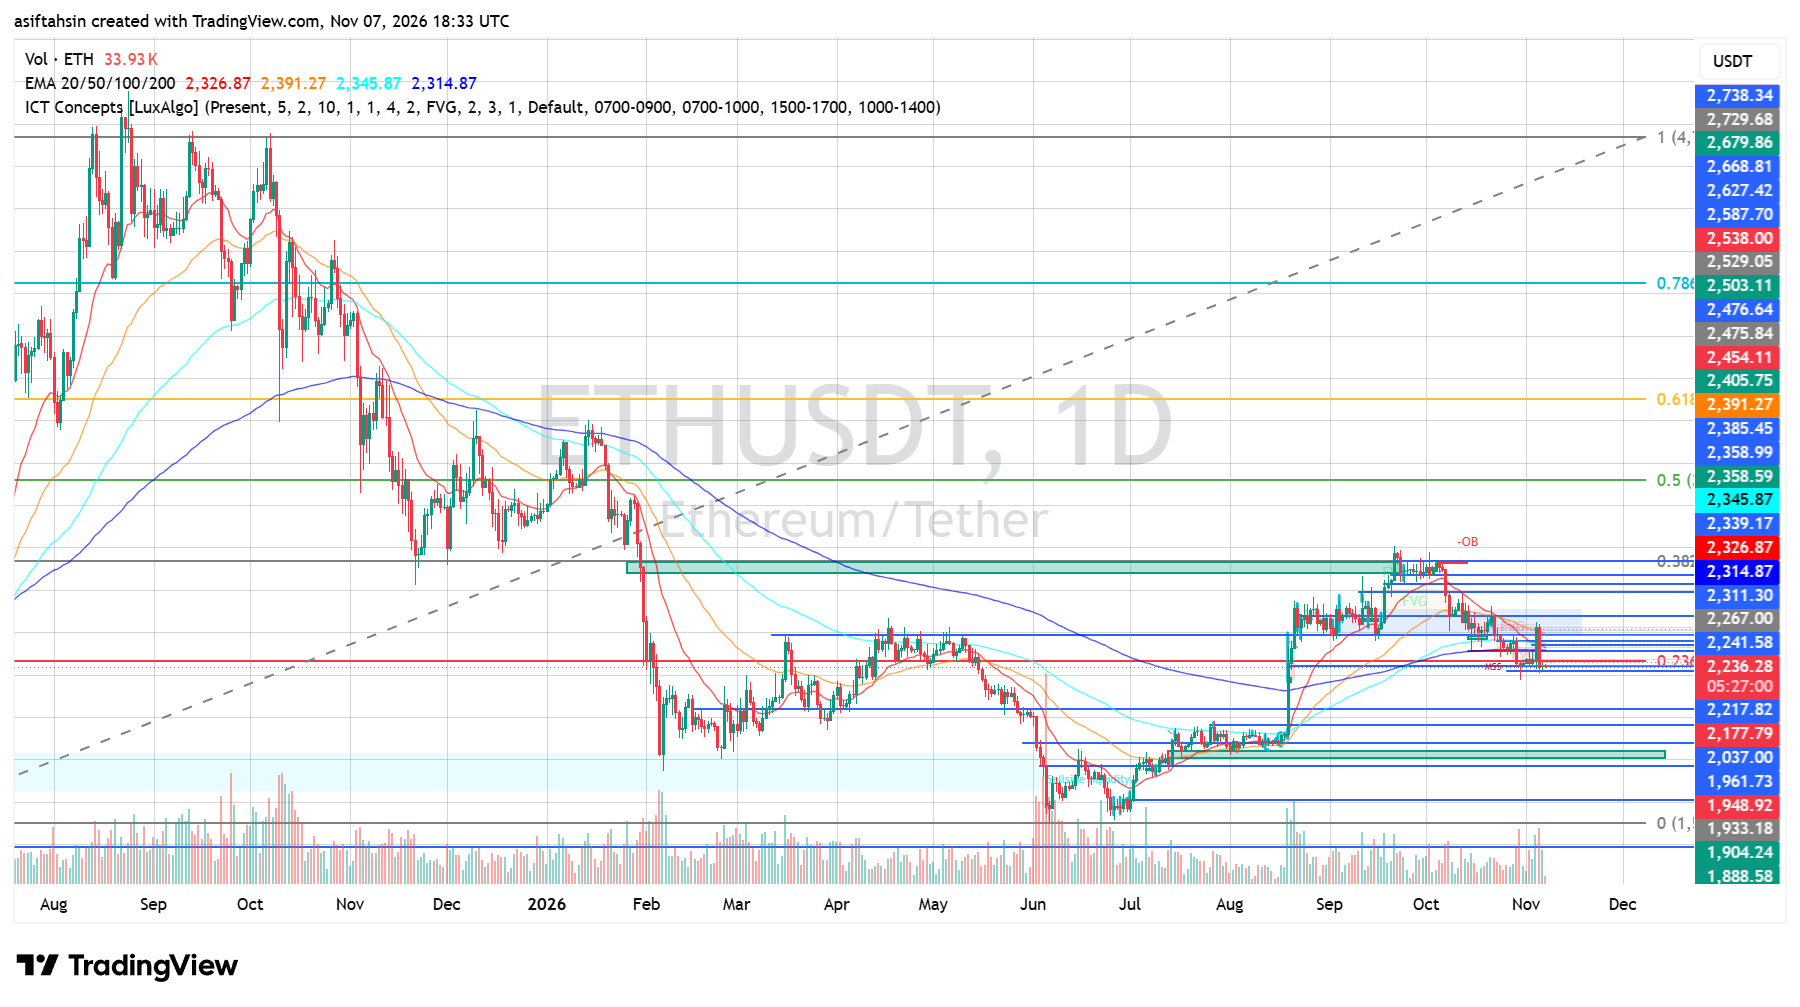
ETH previously recovered strongly from its June–July lows and rallied through August and September. However, the recent rejection around $2,300–$2,320 has weakened the recovery structure.
Price is now consolidating near local support, with several liquidity levels positioned above and below the current range.
A breakdown below the recent support zone could expose lower liquidity, while a reclaim of the nearby resistance cluster would improve the recovery setup.
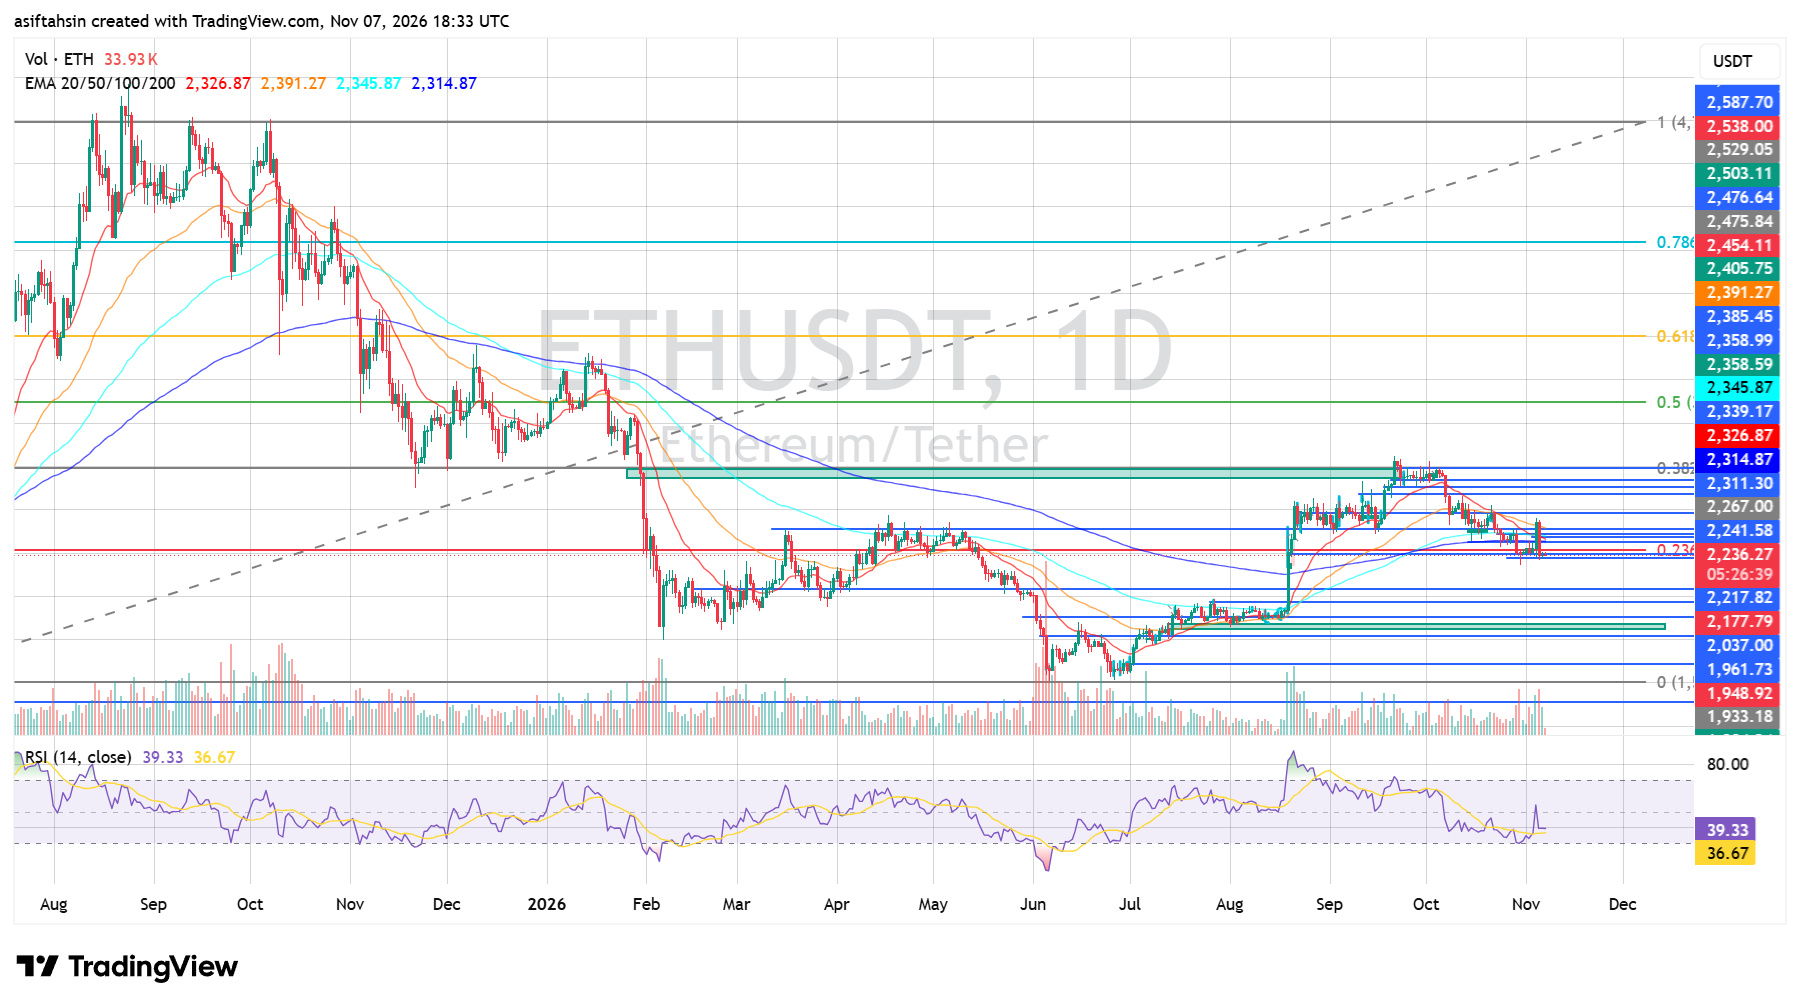
4. RSI Momentum
- RSI: 39.33
- RSI Moving Average: 36.67
RSI remains below the neutral 50 level, indicating that bullish momentum is still limited.
However, RSI is trading above its moving average, suggesting a modest improvement in short-term momentum. A sustained recovery above 50 would provide stronger confirmation that buyers are returning.
5. Key Support Levels
Important downside levels to monitor:
- $2,217.82 – Immediate support
- $2,177.79 – Next support
- $2,037.00 – Major demand zone
- $1,961.73 – Lower support
- $1,948.92 – Additional support
- $1,933.18 – Major Fibonacci baseline
- $1,904.24–$1,888.58 – Deeper support region
A daily close below $2,217.82 could increase the probability of a move toward $2,177.79. Losing that level would put the $2,037 region into focus.
6. Key Resistance Levels
For a bullish recovery, ETH needs to reclaim:
- $2,241.58 – Immediate resistance
- $2,267.00 – Short-term resistance
- $2,311.30–$2,314.87 – Important resistance and EMA cluster
- $2,326.87 – EMA 20
- $2,345.87 – EMA 100
- $2,358.59 – Fibonacci 0.5
- $2,391.27 – EMA 50 and Fibonacci 0.618
- $2,405.75 – Higher resistance
- $2,503.11 – Fibonacci 0.786
A sustained move above $2,358.59 would strengthen the recovery structure, while reclaiming $2,391.27 could open the way toward higher resistance.
7. Bullish Scenario
If ETH holds the $2,217–$2,177 support zone and buyers regain control, a recovery toward $2,241.58 and $2,267 could develop.
A breakout above $2,267 may bring the $2,311–$2,346 resistance cluster into focus.
A stronger bullish recovery would require ETH to reclaim $2,358 and eventually $2,391 with convincing momentum.
8. Bearish Scenario
If ETH fails to hold $2,217.82 and breaks below $2,177.79, selling pressure could increase.
The next important downside area would be around $2,037. A deeper correction could bring $1,961–$1,933 into focus.
Final Outlook
Ethereum remains technically weak on the daily chart, trading below all four major EMAs. RSI shows a modest improvement, but bullish momentum has not yet been confirmed.
The $2,217–$2,177 zone is critical for buyers. Reclaiming $2,267 would be the first positive signal, while a move above the $2,314–$2,346 EMA cluster would provide stronger evidence of recovery.
For now, ETH is at an important decision zone. Watch the daily candle close, support reaction, and momentum before assuming a trend reversal.
Short-term outlook: Bearish below $2,314–$2,346.
