
CoinGlass Binance BTC/USDT Spot Liquidity & Order Book Report
(Based on the screenshot posted by @coinglass_com on 6 November 2026)
Overview
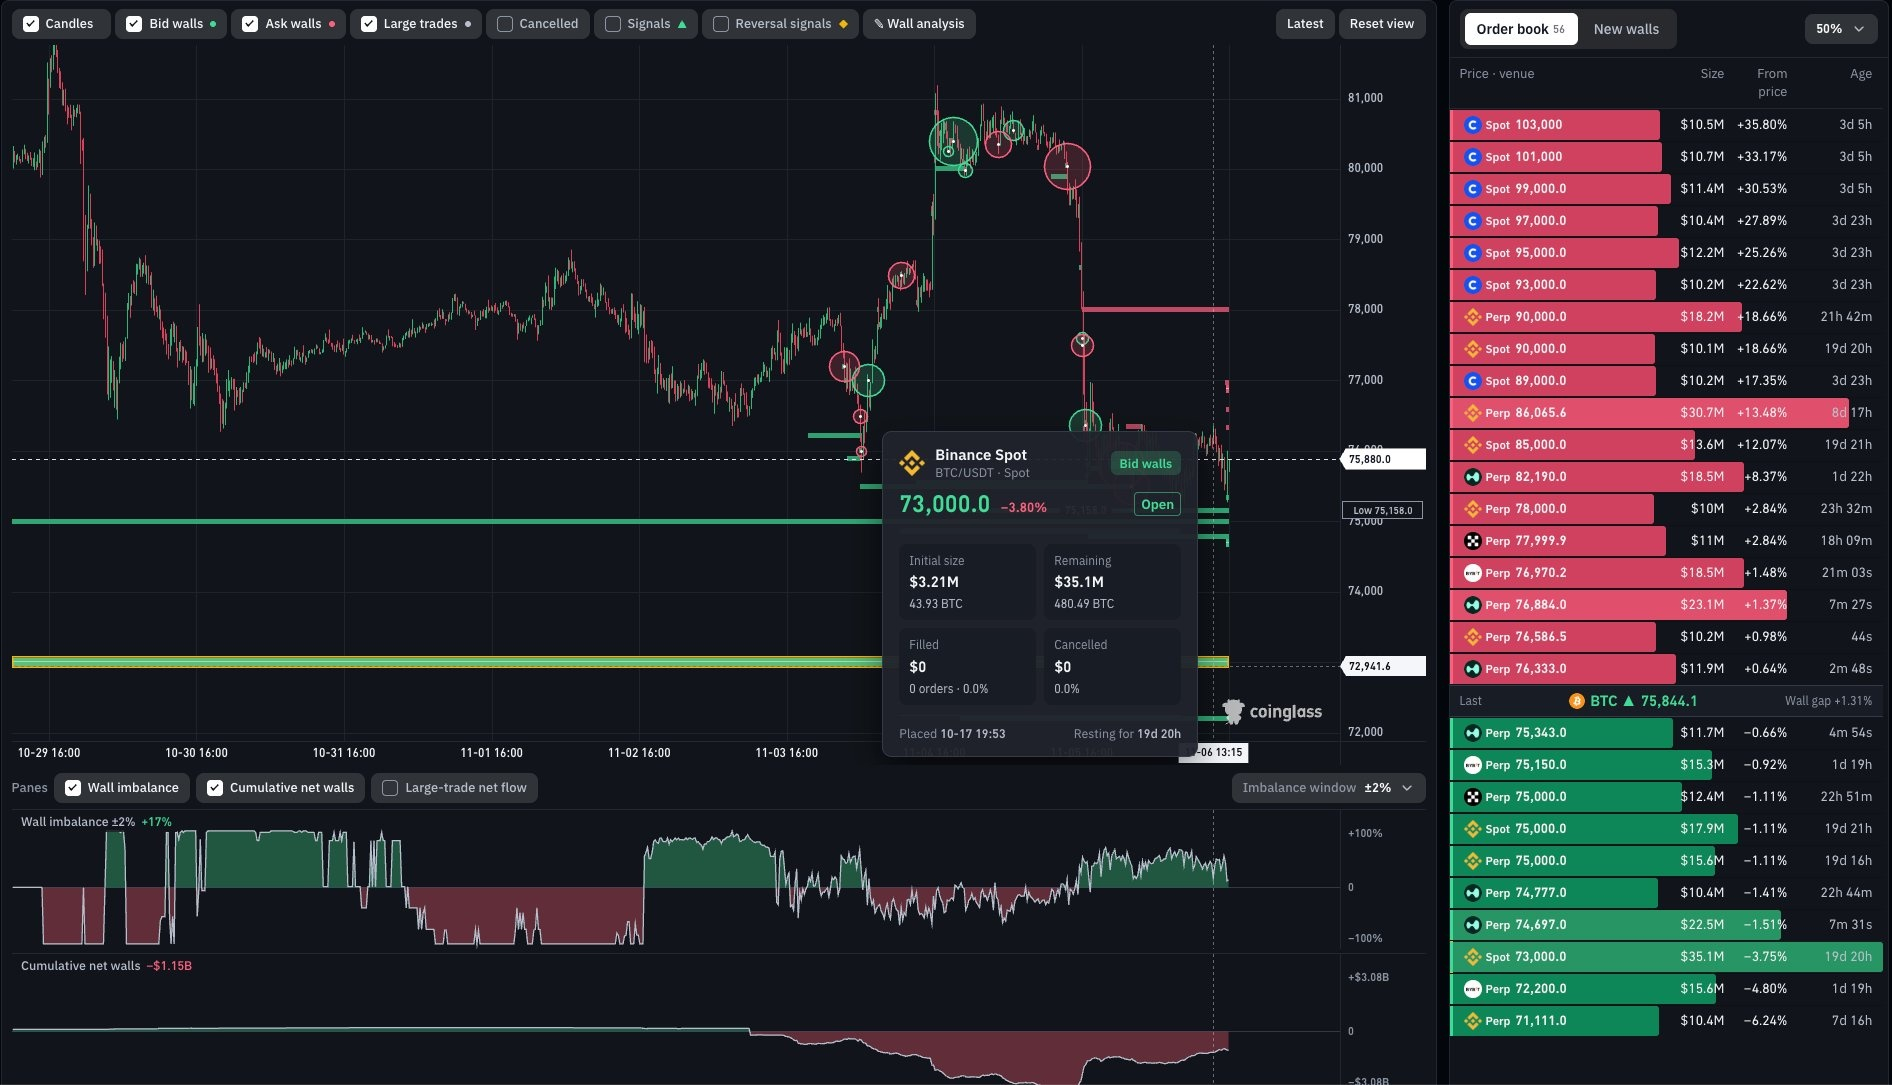
From the image, a dashboard view of #Binance Spot BTC/USDT. It combines a candlestick chart, order-book walls, a highlighted large resting order, and cumulative liquidity metrics. The current price area visible on the chart is roughly the mid-$70,000s, with recent price action showing a sharp rejection from the low-$80,000s followed by a decline.
Key Observations from the Chart & Overlay
Price action: The candlestick chart shows elevated volatility. Price recently traded up toward ~$80,000–$81,000 before reversing. Several green and red circles mark large trades or signals near the highs and on the way down. Horizontal lines highlight significant bid/ask walls.
Highlighted order (popup): A large resting bid on Binance Spot at $73,000.
Initial size: ~$5.21M (43.93 #BTC )
Remaining: ~$35.1M (480.49 BTC)
Status: Open, placed earlier, with zero filled and zero cancelled so far.
This is a substantial bid wall sitting just below the current trading range.
Right-hand order book: Dominated by large ask walls (red bars) at much higher prices:
Spot levels at $103,000 (~$10.5M), $101,000, $99,000, $97,000, $95,000, $93,000, $90,000, $89,000, and others.
Many of these walls are several million dollars each and have been resting for hours to days.
Lower levels also show mixed spot and perpetual walls, including some green (bid) interest closer to the market.
Bottom panels:
Wall imbalance: +17% (currently more bid-side imbalance in the selected window).
Cumulative net walls: approximately –$1.15B (net sell-side liquidity across the broader book).
Imbalance window: –12%.
Liquidity Analysis
The most striking feature is the concentration of large sell walls far above the current price (roughly $89k–$103k). These represent significant resting liquidity that price would need to absorb if it rallies. At the same time, a sizeable bid wall remains at $73,000 with roughly $35M still unfilled.
This creates a classic “liquidity sandwich”:
Downside magnet / support zone near $73,000.
Upside resistance / liquidity targets clustered between ~$89,000 and $103,000.
CoinGlass’s own reply context and typical interpretation of these dashboards note that liquidity does not guarantee price will reach those levels — walls can be pulled, partially filled, or left untouched for long periods.
Market Implications
Short-term: The $73,000 bid wall is a clear area of interest for potential support. A clean break below it could accelerate selling given the cumulative net wall figure.
Medium-term: The dense ask walls higher up act as potential targets if buyers regain control, but they also represent meaningful overhead supply that could stall or reverse rallies.
Overall tone of the post: The original CoinGlass post consisted only of the thinking-face emoji (🤔) alongside the screenshot. This is consistent with CoinGlass’s style of highlighting unusual or noteworthy order-book configurations without explicit directional commentary.
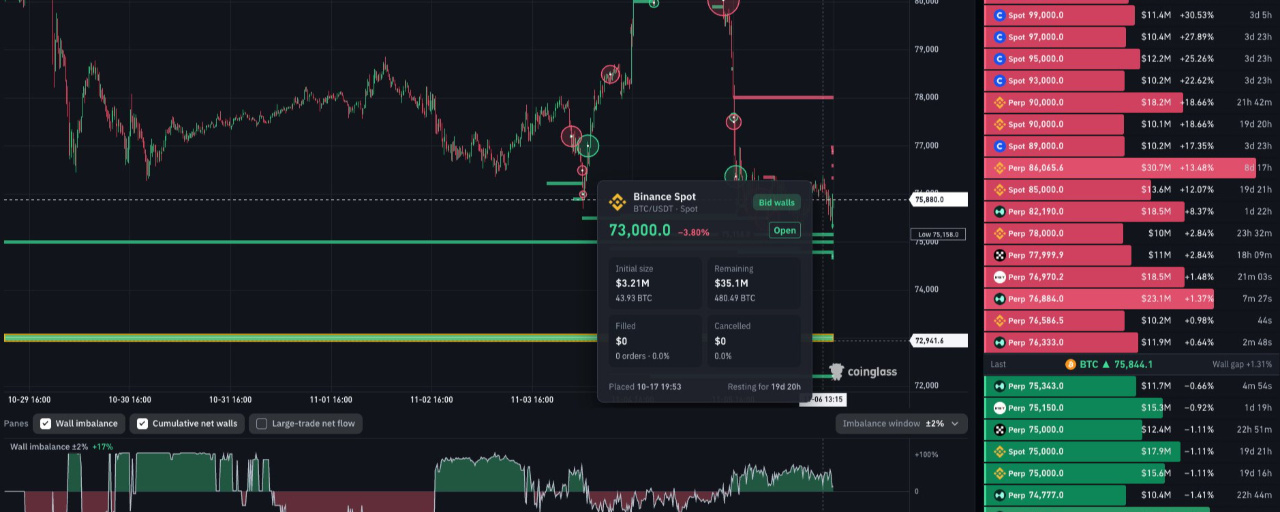
Summary: The image shows a Bitcoin spot order book with a large remaining bid wall at $73,000 and substantial sell walls clustered well above current price (especially $89k–$103k). The setup highlights clear liquidity pockets both below and far above the market, with a currently net-negative cumulative wall balance.