

### $BOME /USDC – Strong Price Prediction

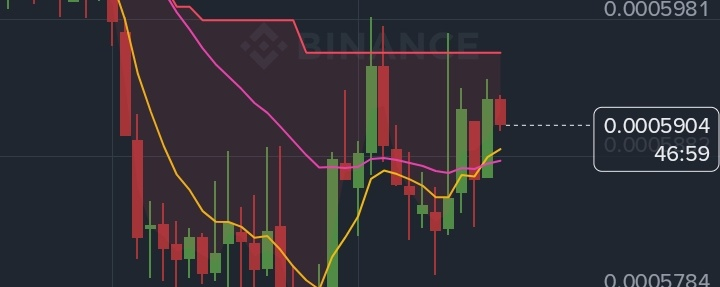
Based on your Binance screenshot (November 3, 2026), BOME is showing a short-term recovery, but it has not yet confirmed a full bullish reversal.
### 0.0005923 USDC
24-hour change
+1.91%
24-hour high
0.0005972
24-hour low
0.0005727
### 1\. Technical analysis – 1-hour chart
Your indicators show:
* EMA 7: 0.0005887 – bullish.
* EMA 25: 0.0005879 – bullish.
* EMA 99: 0.0006013 – bearish resistance overhead.
* Supertrend: 0.0005957 – resistance; bullish confirmation is still missing.
My interpretation: Buyers are recovering control in the short term, but sellers may defend the 0.0005957–0.0006013 zone.
### 2\. International market and financial conditions
The latest market information available for November 3:
* Bitcoin: Arthur Hayes warns that weakness may continue until the Federal Reserve or banks expand their balance sheets. This is a potential headwind for speculative altcoins. BeInCrypto +1
* Crypto sentiment: CoinMarketCap's analysis reports a Fear reading of 33 and wider risk aversion following a reported Binance security incident. CoinMarketCap
* BOME market activity: CoinGecko reports approximately $40.3 million market capitalization and $6.2 million 24-hour volume. CoinGecko
* Analyst indicators: Investing.com shows a technically positive oscillator reading, but moving averages remain neutral. Investing.com
Regarding wars and geopolitics: I cannot verify a specific new war-related development that directly explains BOME's movement today. However, escalating geopolitical tensions, rising oil prices or tighter financial conditions could weaken speculative crypto demand.
### 3\. Important BOME price levels
| Level | Price (USDC) | Meaning |
| -------------------- | ------------ | ---------------- |
| Resistance 3 | 0.0006179 | Higher target |
| Resistance 2 | 0.0006084 | Strong target |
| Resistance 1 | 0.0006013 | EMA99 |
| Immediate resistance | 0.0005957 | Supertrend |
| Current | 0.0005923 | Screenshot |
| Support 1 | 0.0005879 | EMA25 |
| Support 2 | 0.0005784 | Chart support |
| Support 3 | 0.0005727 | 24h low |
| Critical support | 0.0005704 | Recent chart low |
### 4\. My price prediction
These are scenario estimates, not guaranteed outcomes.
Bullish scenario
35% estimated chance
### 0.0006013–0.0006179
If BOME breaks 0.0005972 and holds above 0.0006013 with strong volume, this becomes possible.
Sideways scenario
40% estimated chance
### 0.0005820–0.0005970
Consolidation while buyers and sellers fight around resistance.
Bearish scenario
25% estimated chance
### 0.0005727–0.0005600
If 0.0005784 breaks, another support test becomes possible.
My subjective scenario weights, not statistical probabilities or analyst consensus.
### 5\. Trading strategy
Safer entry approach
* Avoid chasing a green candle at resistance.
* Watch for a 1-hour candle close above 0.0005972.
* Stronger confirmation: close above 0.0006013 with increasing volume.
* If price falls below 0.0005784, be careful of further downside.
* Keep a stop-loss appropriate to your risk; do not average down blindly.
### 6\. Final verdict
### Short-term recovery possible
My expectation is that BOME will first attempt to test 0.0005957–0.0006013. A confirmed breakout could take it toward 0.0006084–0.0006179.
But if 0.0005784 fails, I would change my outlook to bearish.
This is a conditional forecast based on your screenshot and the available market evidence, not a guaranteed prediction. The latest CoinGecko quote is also slightly different from your Binance screenshot, so use Binance's live price for actual orders.
One important question: Are you holding BOME already, or planning to buy now?
I can also create a BOME future-candle p
rediction image showing the bullish and bearish paths on your 1-hour chart.
Make BOME next candle prediction image
#BinanceRestores28FiatWithdrawals #USMidtermElections #USOctoberNFP-AreRateCutsStillPossible $BOME