

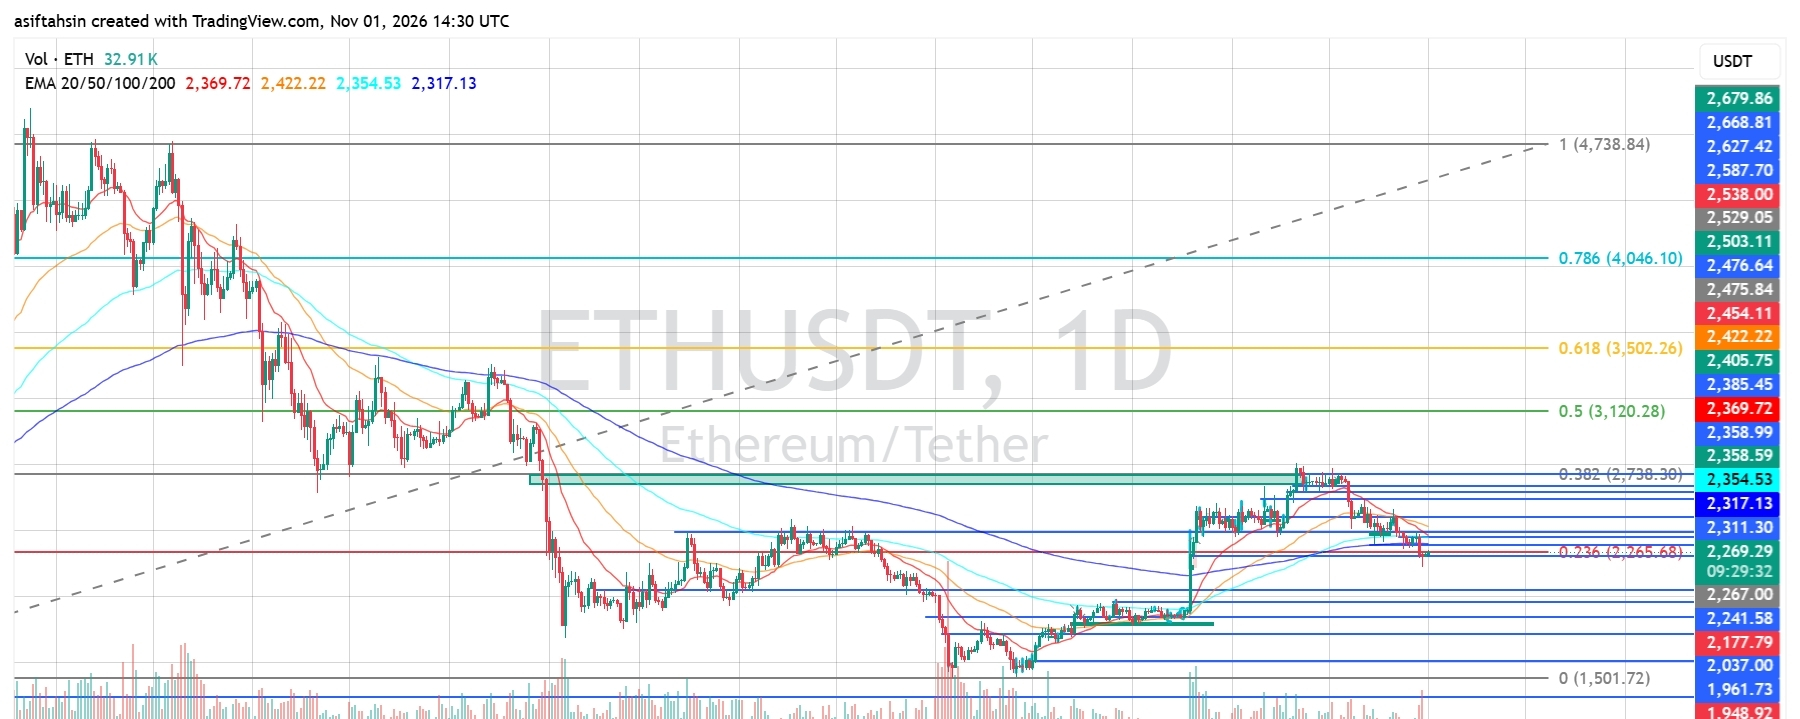

Ethereum is currently trading around $2,269, facing renewed selling pressure after failing to sustain its recovery toward the $2,475–$2,500 resistance zone. ETH has pulled back from its recent highs and is now testing the important $2,265–$2,267 support area, close to the 0.236 Fibonacci level.
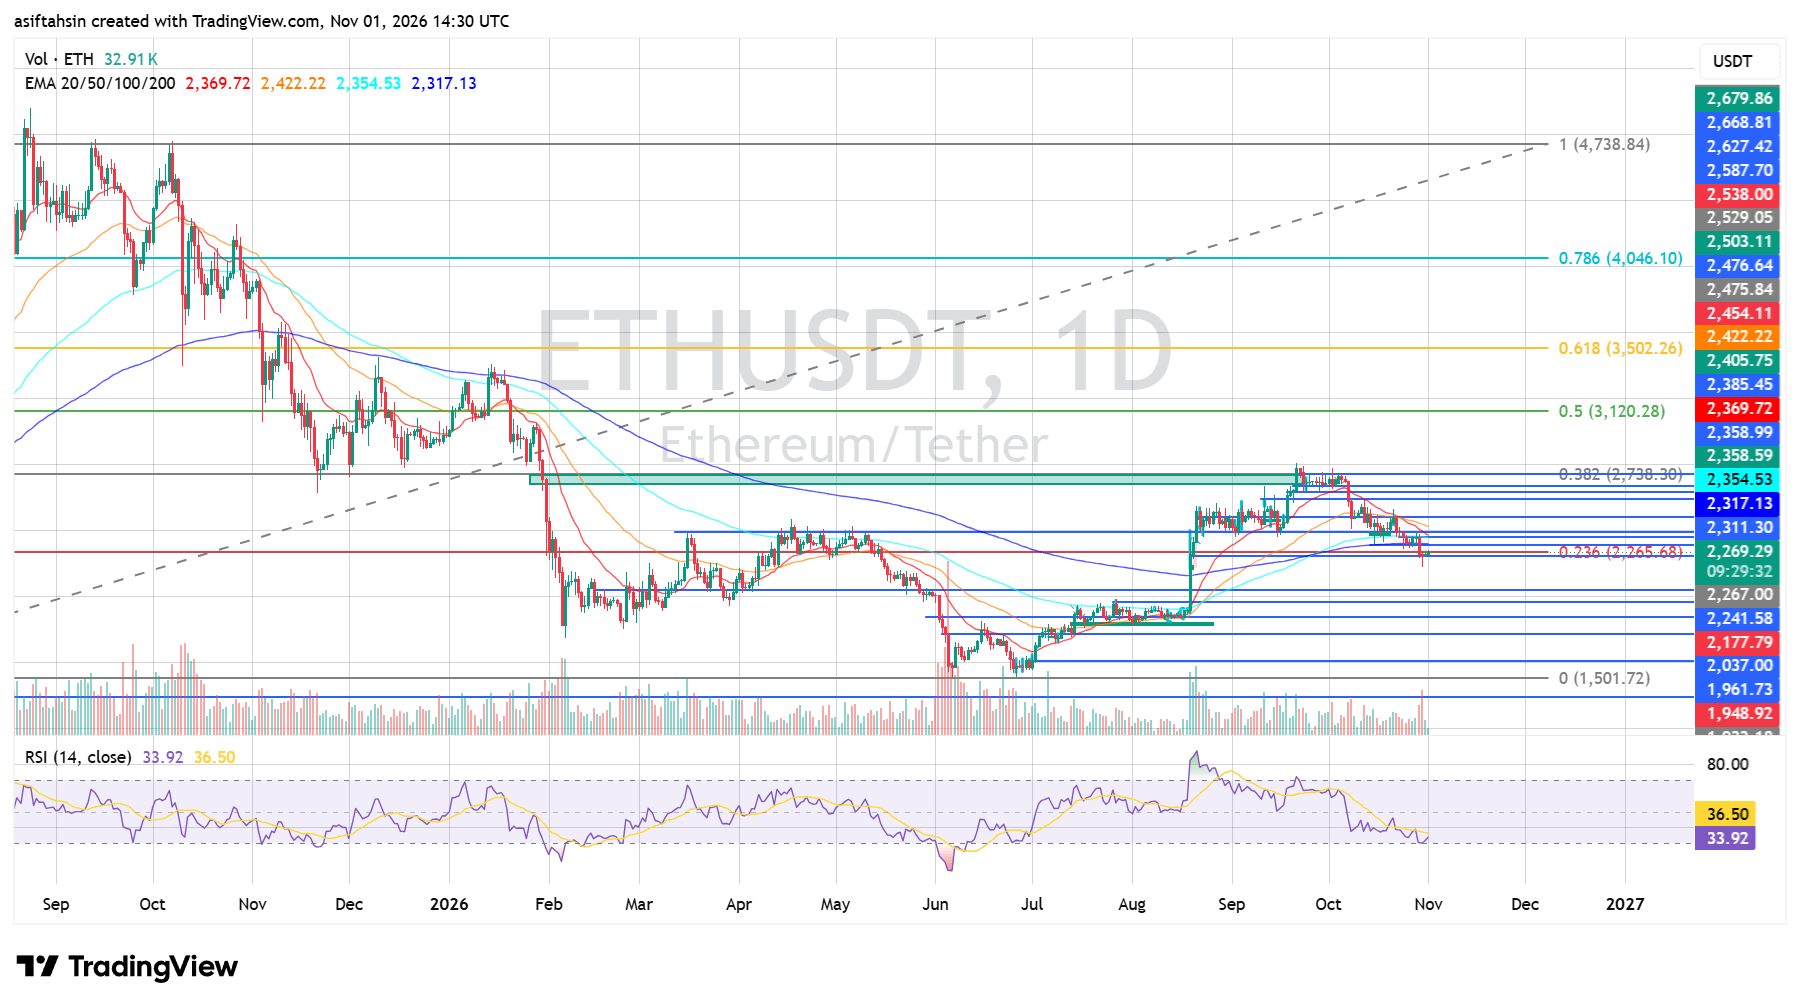
The short-term structure has weakened significantly, with ETH trading below all four major EMAs. RSI has also dropped to 33.92, indicating strong bearish momentum. Buyers need to reclaim the $2,311–$2,370 resistance region to improve the outlook, while losing $2,265 could expose lower support zones.
EMA Structure
* 20 EMA: $2,369.69
* 50 EMA: $2,422.21
* 100 EMA: $2,354.53
* 200 EMA: $2,317.13
ETH is trading below all four EMAs, indicating that sellers currently have control of the short-term structure.
The 200 EMA near $2,317 is the first important moving-average resistance. Above that, the $2,354–$2,370 zone represents another major barrier, followed by the 50 EMA near $2,422.
A sustained recovery above these moving averages would be needed to restore bullish momentum.
Fibonacci Levels
Based on your chart:
* 0: $1,501.72
* 0.236: $2,265.68
* 0.382: $2,738.30
* 0.5: $3,120.28
* 0.618: $3,502.26
* 0.786: $4,046.10
* 1.0: $4,738.84
ETH is currently trading just above the 0.236 Fibonacci level near $2,265.68. This is an important support area to watch.
If buyers defend this level, a relief bounce could develop. However, a confirmed breakdown below it would weaken the broader recovery and increase the risk of further downside.
Bullish Scenario
If ETH holds the $2,265–$2,267 support zone and buyers regain momentum, a recovery could develop toward:
- $2,311–$2,317
- $2,354–$2,370
- $2,385
- $2,422–$2,454
- $2,476–$2,503
- $2,538
A sustained move above $2,317 would be the first sign of recovery. Reclaiming the $2,354–$2,370 EMA zone would strengthen the bullish outlook, while a breakout above $2,422 could open the path toward $2,475–$2,503.
Pullback Scenario
If ETH fails to defend $2,265 and selling pressure continues, watch these support areas:
* $2,265–$2,267 — 0.236 Fibonacci support
* $2,241
* $2,177
* $2,037
* $1,961–$1,948
* $1,904
A decisive breakdown below $2,265 could expose the $2,241 area first, followed by $2,177.
If selling pressure accelerates and these supports fail, the $2,037–$1,961 region could become the next major downside area.
RSI Momentum
* RSI: 33.92
* RSI Signal Average: 36.50
RSI is below the neutral 50 level and remains under its signal average, confirming bearish momentum.
The indicator is approaching oversold territory. A move back above 40 would be an early sign of improving momentum, while a sustained recovery above 50 would provide stronger confirmation of a bullish shift.
However, oversold conditions alone do not guarantee an immediate reversal.
Market Structure & Liquidity
ETH previously recovered from the June low near $1,501 and rallied toward the $2,475–$2,500 region. However, the latest rejection has resulted in a series of lower highs and a loss of several important moving averages.
Price is now testing the $2,265–$2,267 area, which aligns with the 0.236 Fibonacci level. This is a critical point for the current recovery structure.
The market needs to defend this support and reclaim the $2,317–$2,370 region to improve its short-term outlook. A confirmed breakdown below $2,265 would increase the possibility of another leg down toward $2,177 and potentially lower support zones.
Key Levels
Resistance
* $2,311–$2,317
* $2,354–$2,370
* $2,385
* $2,422–$2,454
* $2,476–$2,503
* $2,538
Support
* $2,265–$2,267
* $2,241
* $2,177
* $2,037
* $1,961–$1,948
* $1,904
Final Outlook
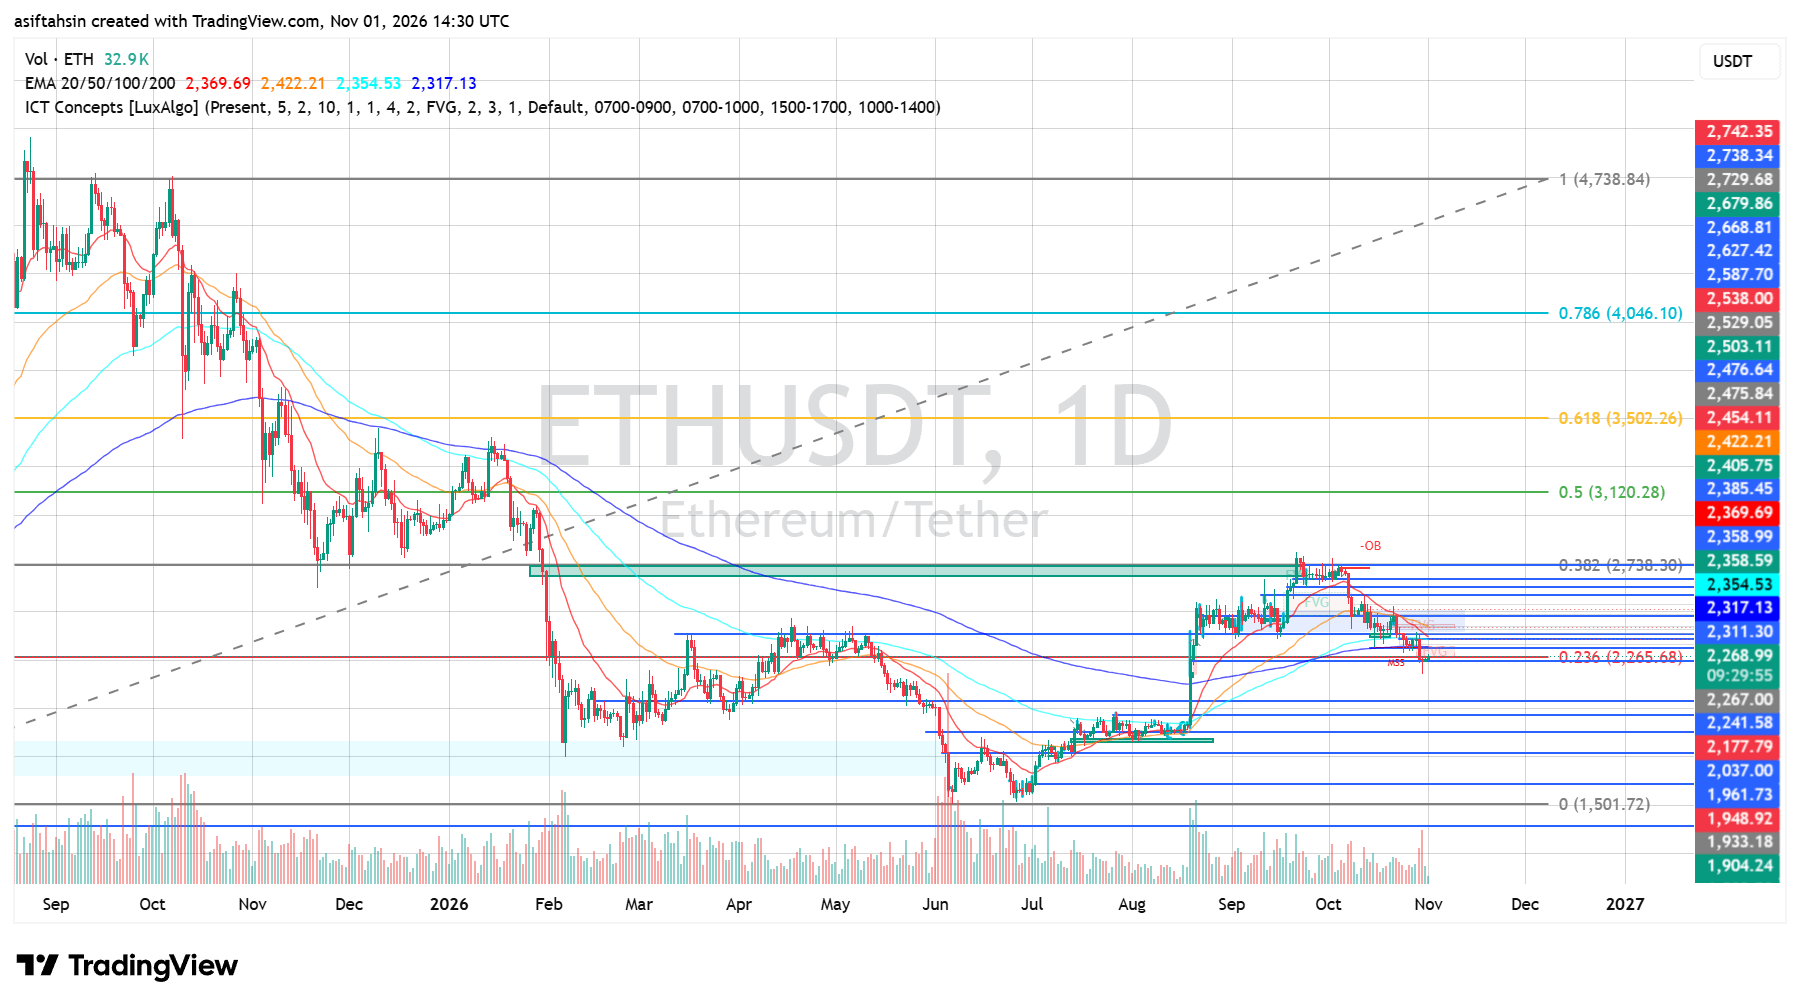
ETH remains bearish in the short term while trading below the $2,317–$2,370 resistance region. Price is testing the important $2,265 Fibonacci support, and RSI confirms that selling pressure remains elevated.
A sustained recovery above $2,370 could open the path toward $2,422–$2,454, followed by $2,476–$2,503. On the downside, losing $2,265 would increase the risk of a deeper correction toward $2,241, $2,177, and potentially $2,037.
Bias: Bearish below $2,370 | Recovery above $2,422 → $2,476 → $2,503
