


Hyperliquid (HYPE) is attracting serious attention after gaining approximately 8.47% in 24 hours.
With the price trading around $93.33, traders are now watching one important zone: $97–$98.33.
But is HYPE preparing for another leg up, or could sellers interrupt the rally?
📊 Technical Breakdown
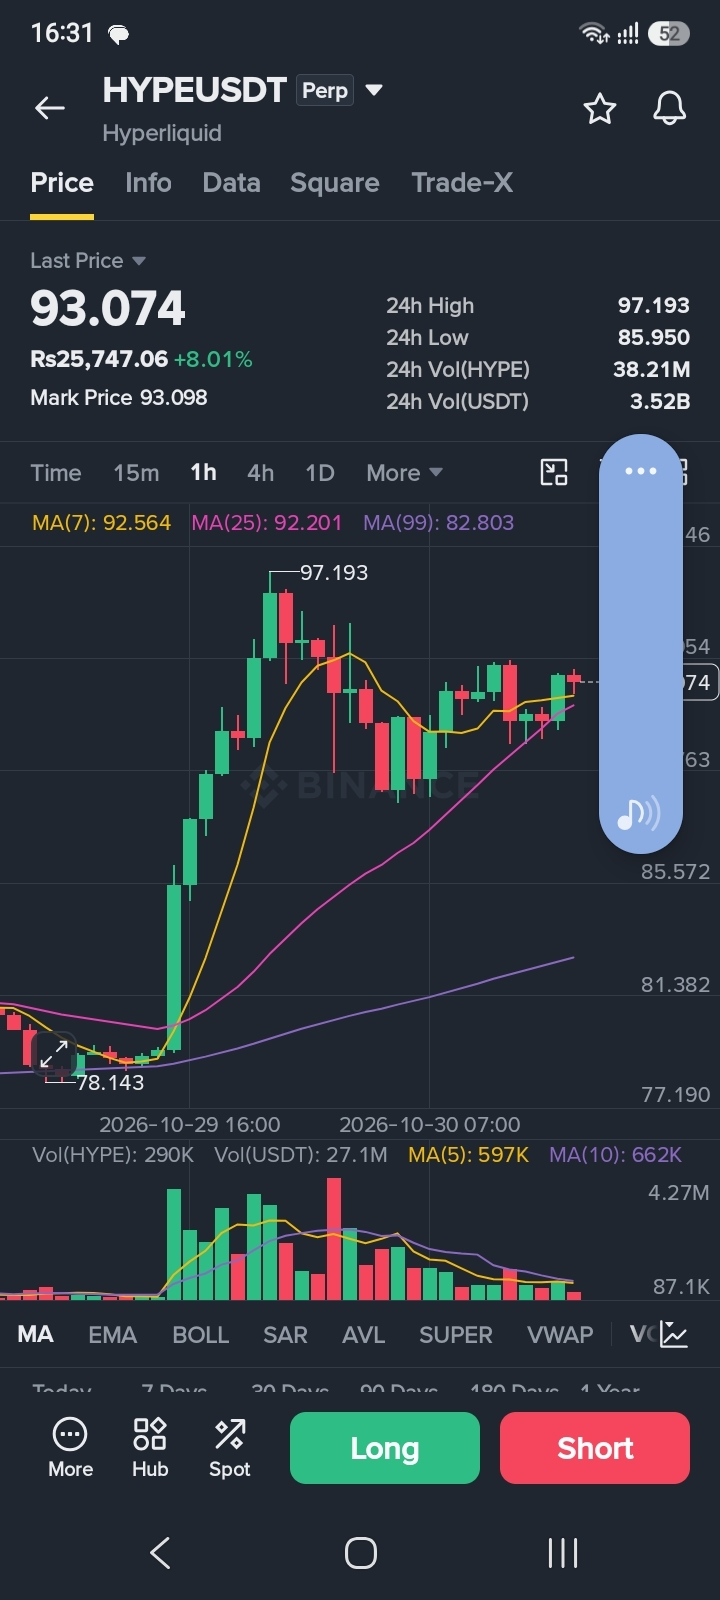
1H Chart
HYPE is trading above its MA(7) at $92.56 and MA(25) at $92.20, showing positive short-term momentum.
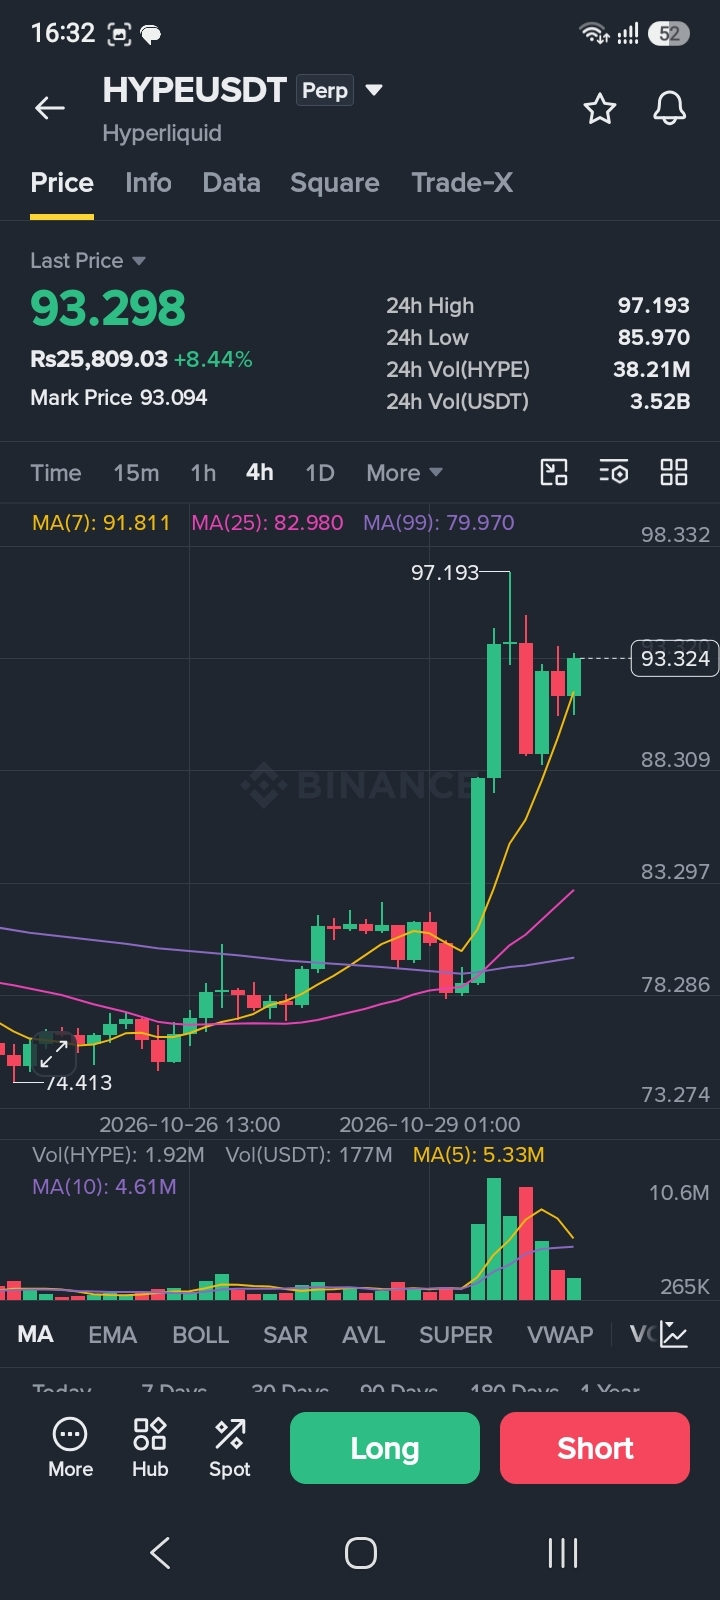
4H Chart
The price remains above its MA(7), MA(25), and MA(99), indicating a strong recovery structure.
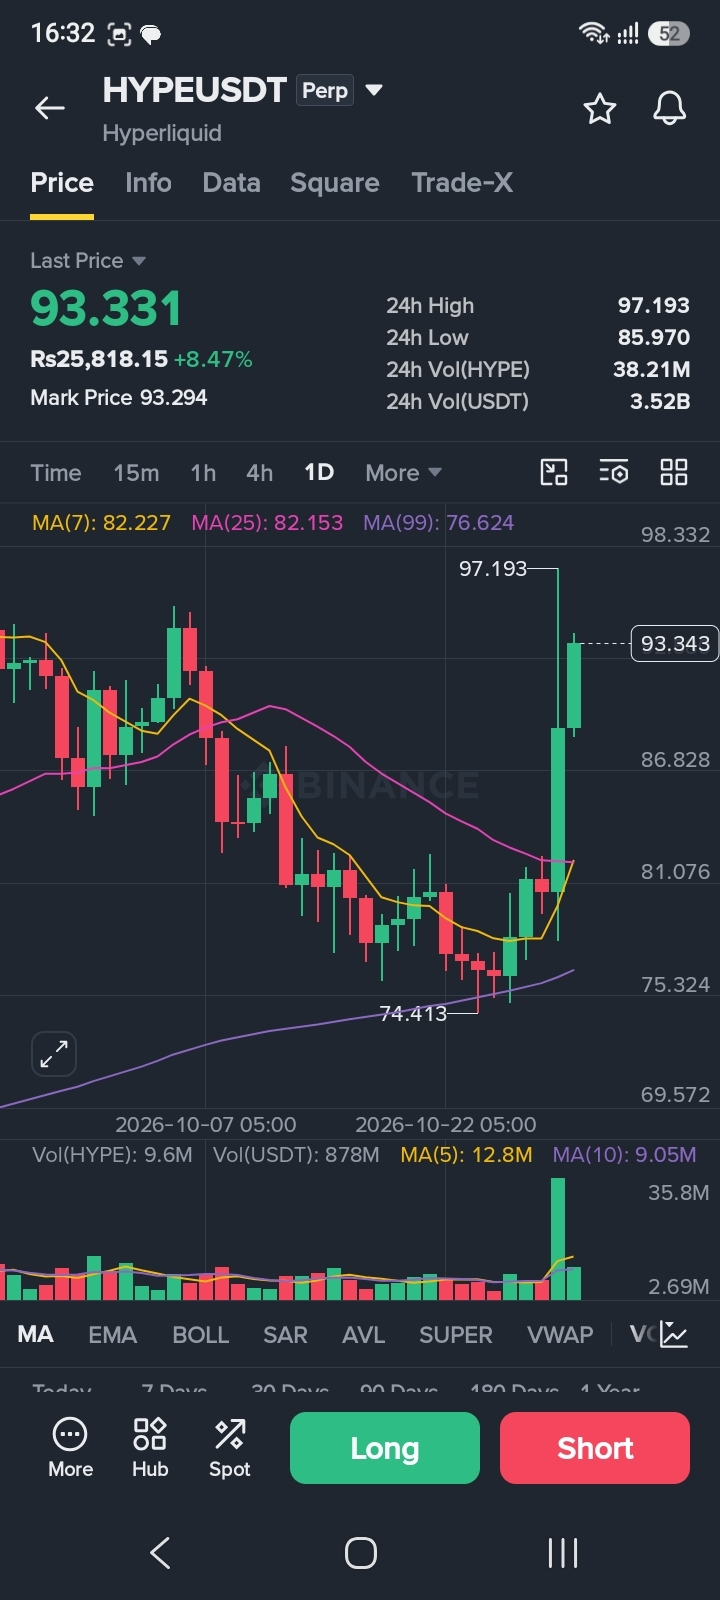
1D Chart
The broader moving-average structure remains positive, with price trading well above the daily averages.
🎯 Key Levels to Watch
Resistance:
$97.19
$98.33
$100–$102
Support:
$92–$91.80
$88.30
$82–$83
🔥 Bullish Scenario
A convincing breakout above $98.33, supported by strong volume, could open the door toward $100–$102.
⚠️ Bearish Scenario
Failure to break resistance could trigger profit-taking and a pullback toward $92 or even $88.30.
My Take
HYPE currently has a constructive technical structure, but the $97–$98.33 resistance zone is the real test.
I would watch volume confirmation before calling this a confirmed breakout.
Can HYPE cross $100, or will sellers step in first?

Share your prediction below!
This article is for educational purposes only and is not financial advice. Market levels are based on the chart screenshots provided and can change quickly.
#HYPE #Hyperliquid #CryptoAnalysis #BinanceSquare #Altcoins #TechnicalAnalysis #CryptoMarket