

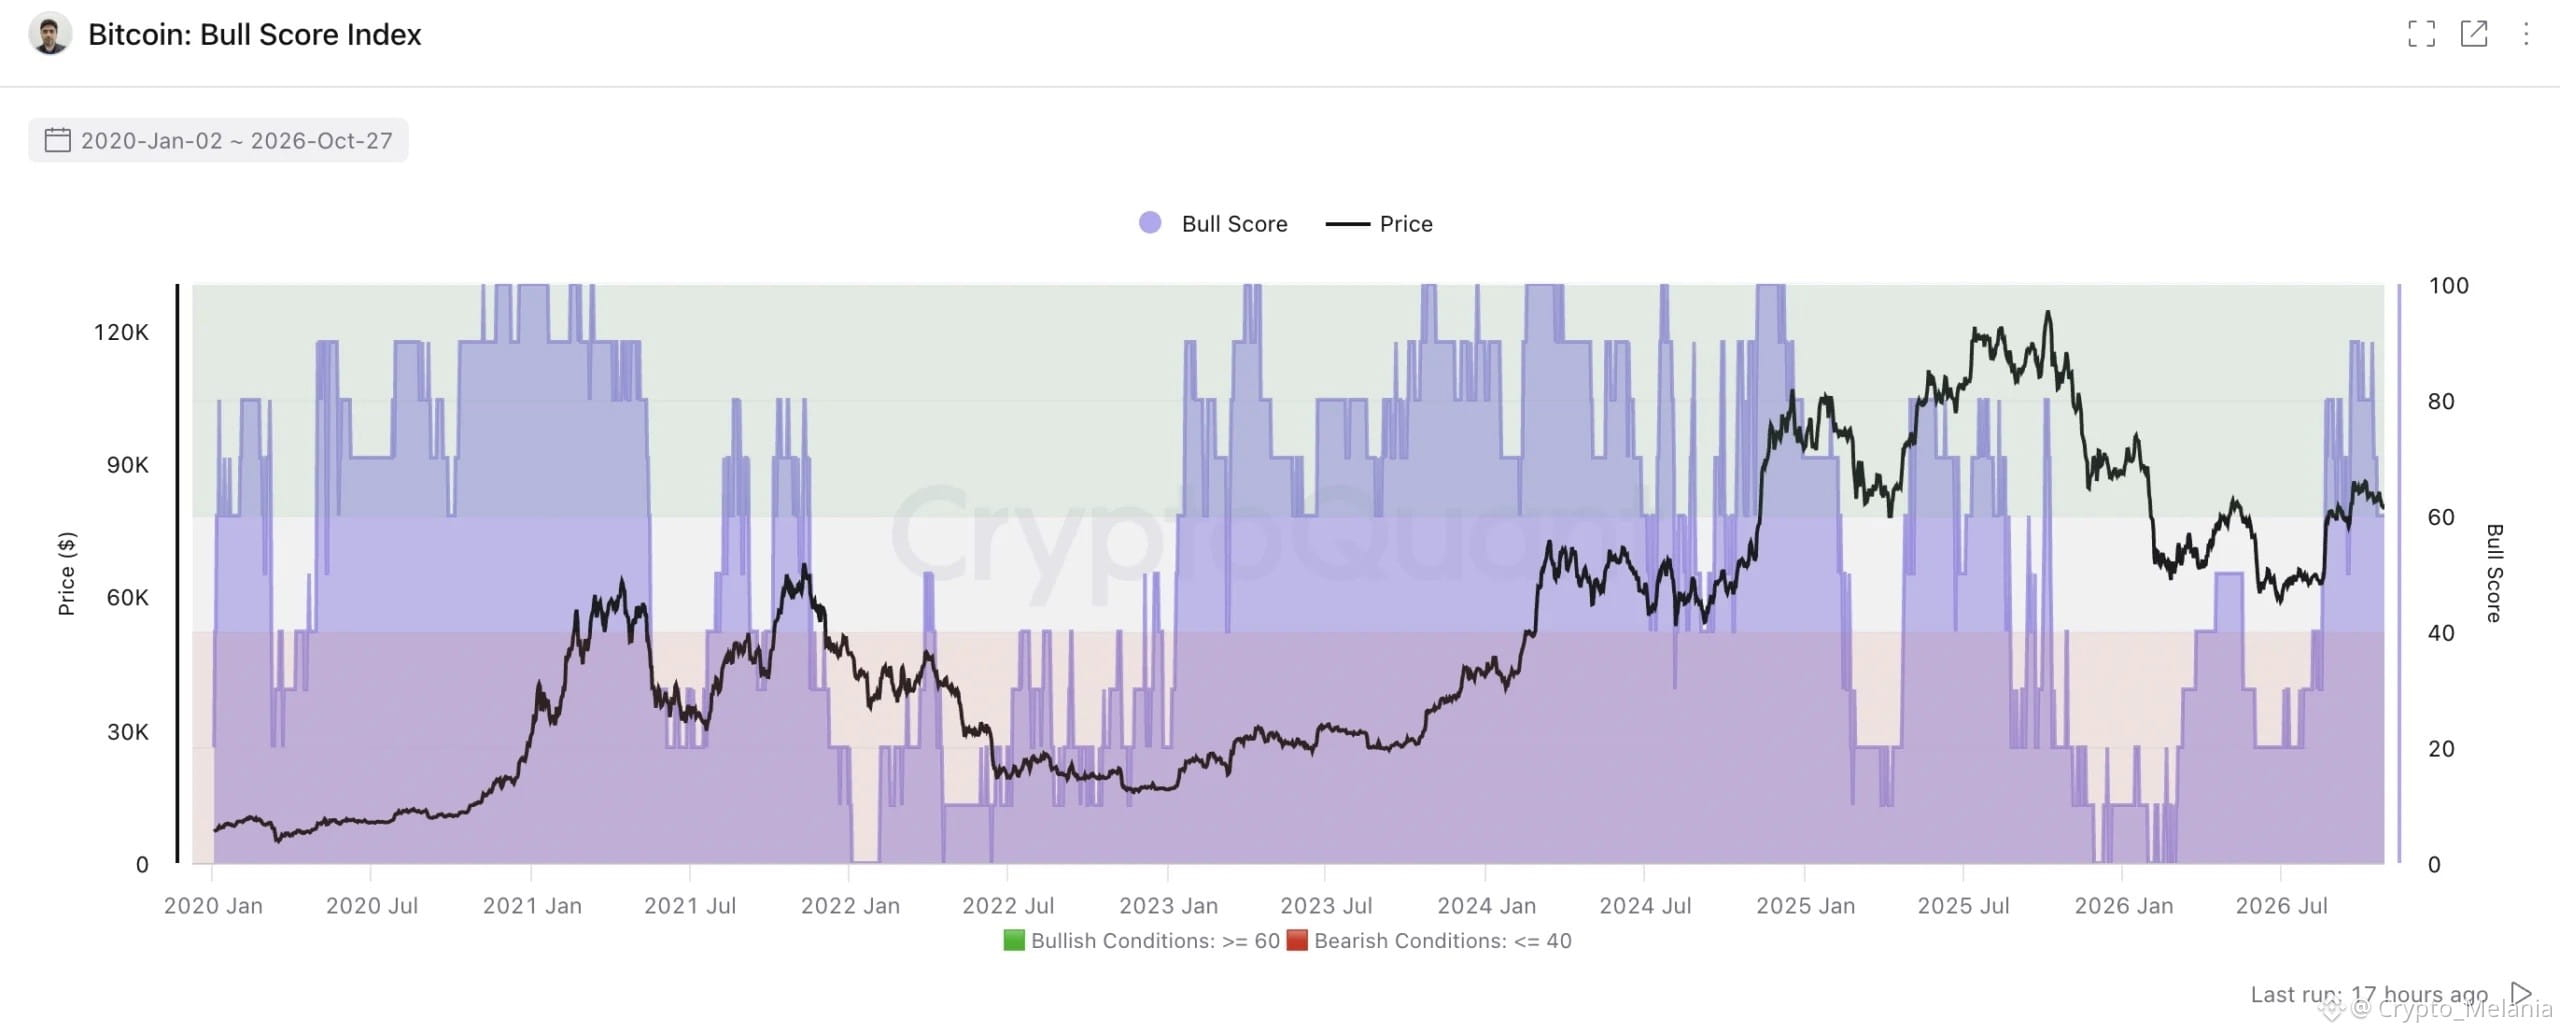
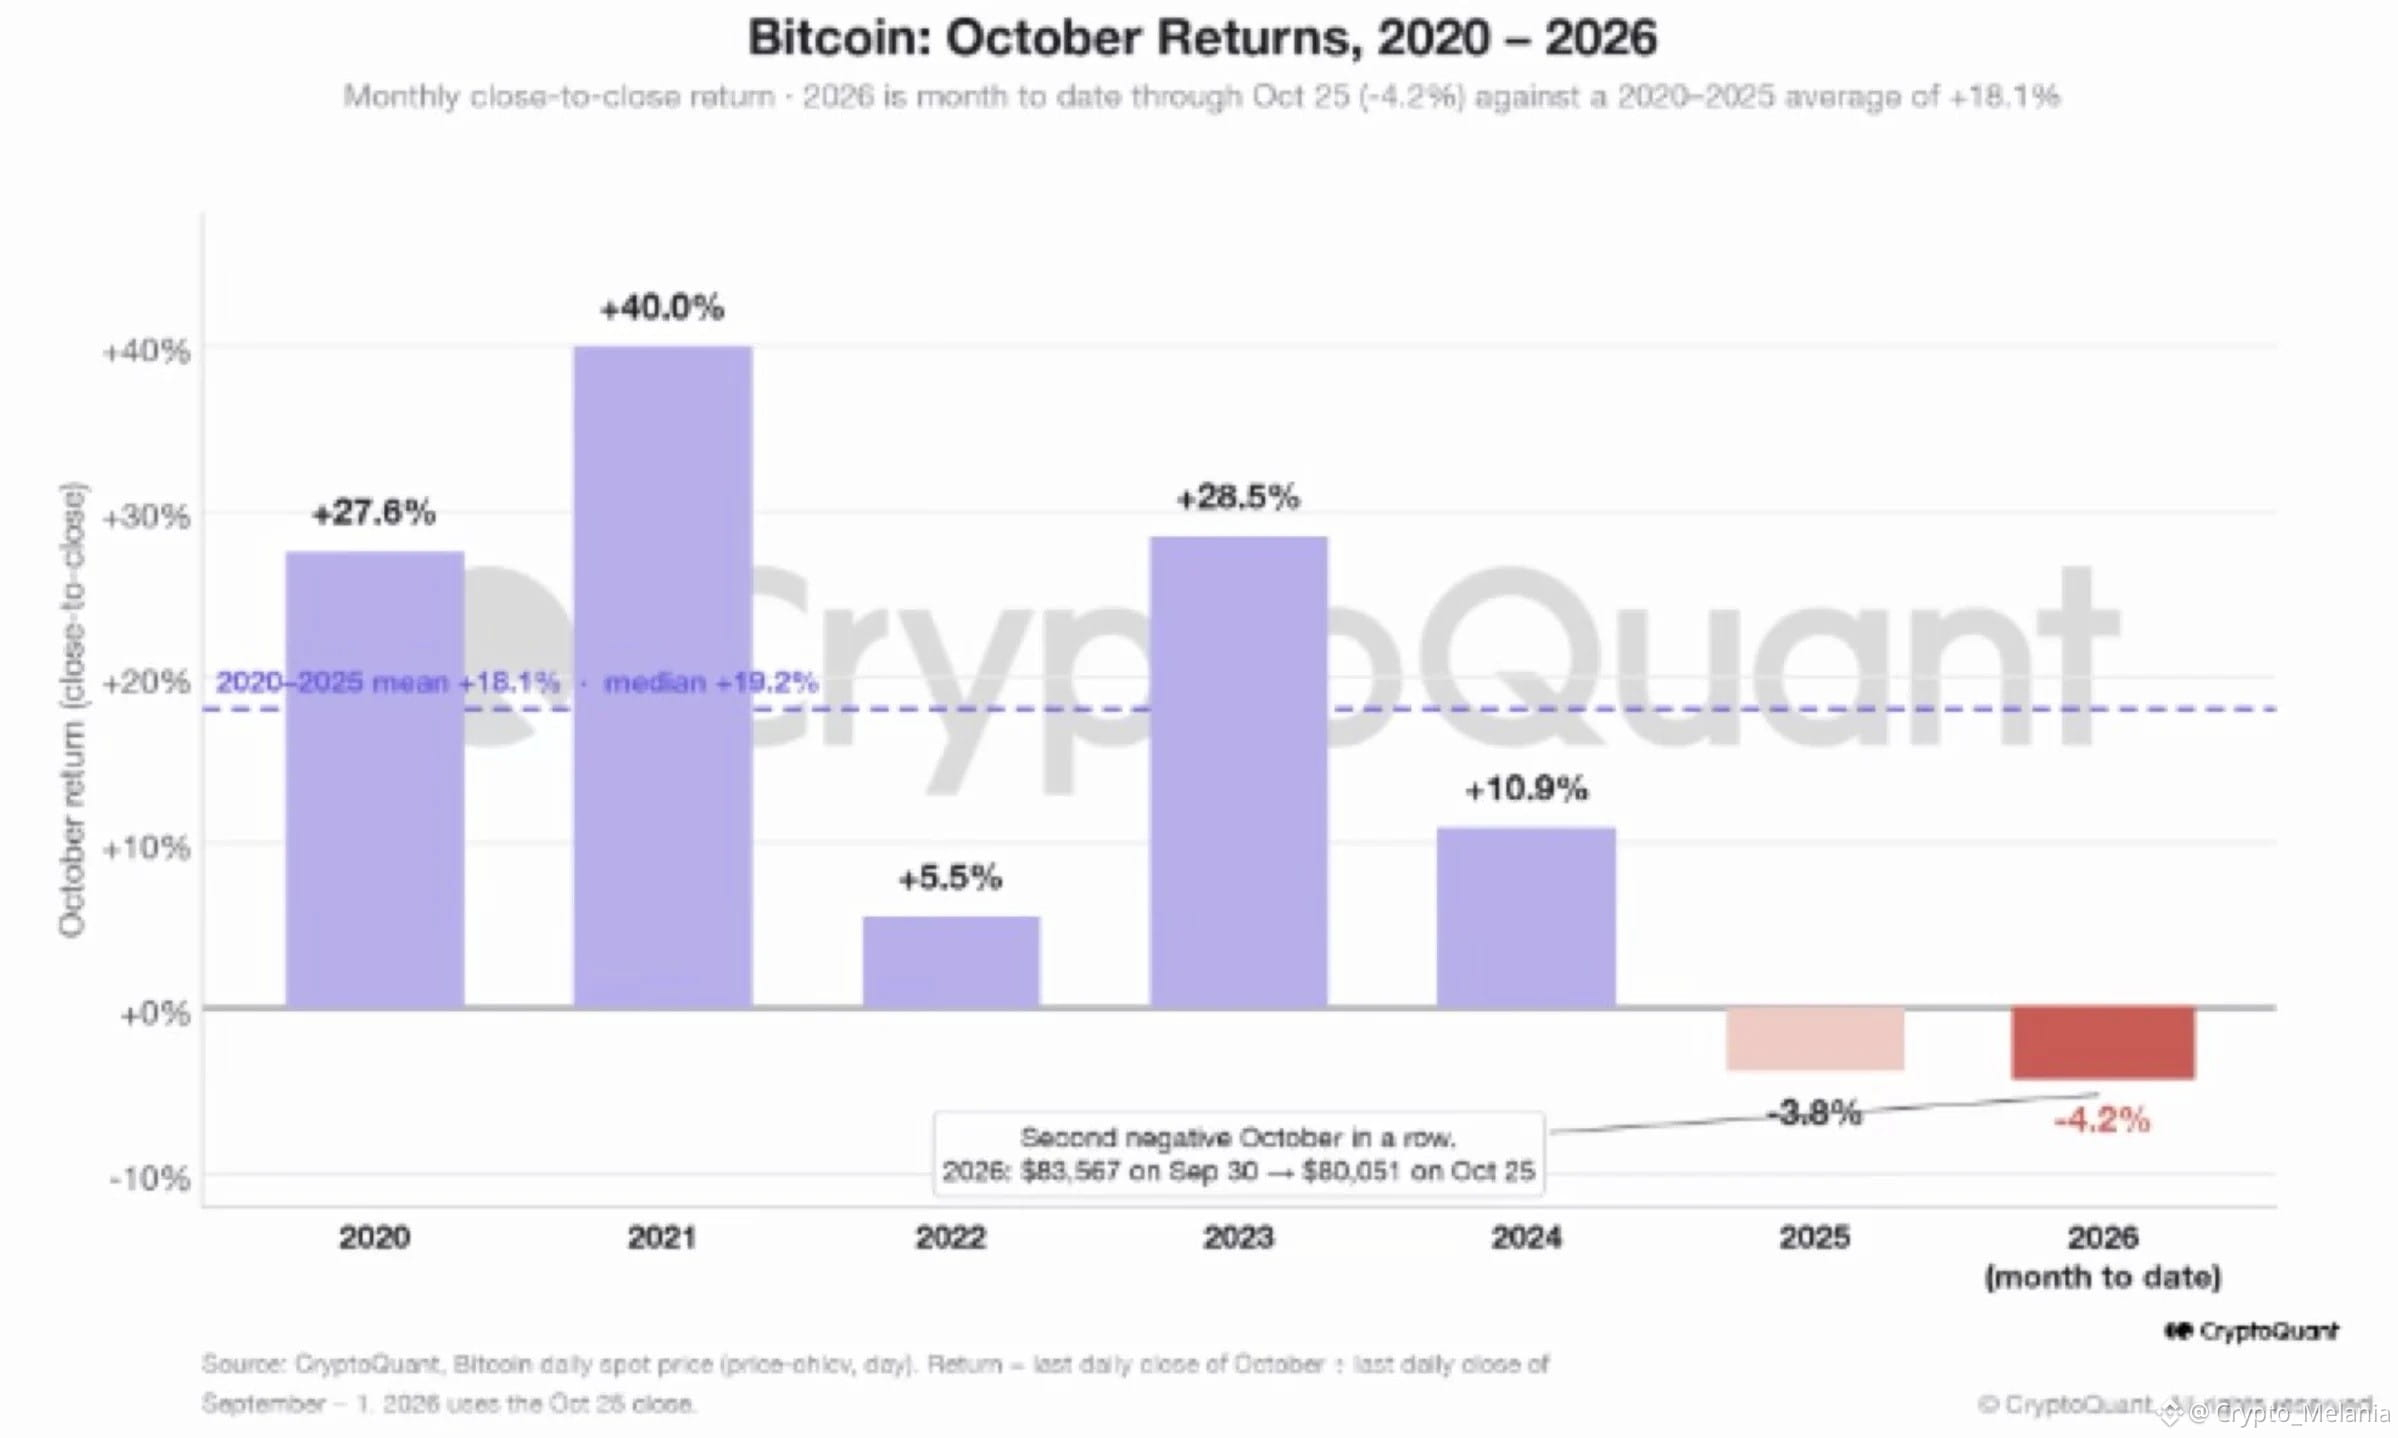
Uptober Didn’t Show Up This Year. Here’s What Got in the Way. Seasonal patterns are comforting right up until they don’t work. 🍂 $BTC was down 4.2% month-to-date as of Oct. 25, against an average October gain of 18.1% from 2020 to 2025. It’s also the second red October in a row, after a 3.8% drop last year. What got in the way was demand. Spot buying kept shrinking, ETF flows stayed weak, and the Bull Score Index slid from 90 to 60. Sixty isn’t bearish on its own, but it tells me several of the signals that usually carry a rally have gone quiet. Leverage is still getting cleaned out too. ⚡ CoinGlass counted 58,857 traders liquidated in 24 hours, about $174.62 million in total. Bitcoin is trading near $81,296, up 1.9% on the day but down 28% over the past year. Still, I’m not writing off the season. The Fear & Greed Index sits at a neutral 51, and September already showed how fast a ‘bad’ month can flip when ETF flows and Coinbase demand turn. With the Fed decision, fresh US data and the Nov. 3 midterms all landing now, November could look very different. 🌱 #BTC Price Analysis# #Bitcoin Price Prediction: What is Bitcoins next move?#

انضم إلى مُستخدمي العملات الرقمية حول العالم على Binance Square
⚡️ احصل على أحدث المعلومات المفيدة عن العملات الرقمية.
💬 موثوقة من قبل أكبر منصّة لتداول العملات الرقمية في العالم.
👍 اكتشف الرؤى الحقيقية من صنّاع المُحتوى الموثوقين.
البريد الإلكتروني / رقم الهاتف