

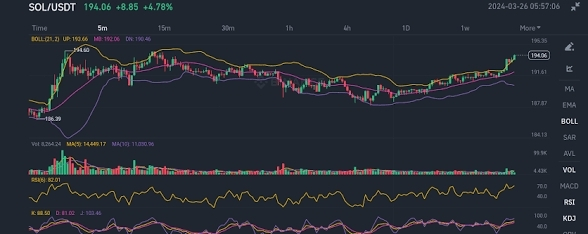

📊 $SOL /USD Technical Analysis

Solana (SOL) vs US Dollar — October 28, 2026
1. Current Market Overview
Solana ($SOL ) is showing short-term bullish momentum, but the price is approaching resistance where a pullback could occur.
Current price: Approximately $102.90
24-hour change: Approximately +1.6% to +3.3%, depending on the data source and timestamp.
Short-term trend: Bullish
Market condition: Potentially overbought on shorter timeframes.
Overall bias: Bullish, but confirmation is needed before entering a trade.
2. Important Support and Resistance Levels
Level Price (USD) Significance
Resistance 3 $112.79 Major upside target
Resistance 2 $106.28 Secondary resistance
Resistance 1 $103.56 Immediate resistance
Current Price $102.90 Current market area
Support 1 $99.13 Immediate support
Support 2 $96.72 Secondary support
Support 3 $91.07 Major support
These levels are based on published daily technical analysis and may change as the market moves.
3. Technical Indicator Analysis
Moving averages: Shorter-term moving averages are generally indicating bullish momentum.
RSI: Some intraday readings are above 70, suggesting overbought conditions and the possibility of a short-term pullback.
MACD: Positive readings on several intraday analyses support the current bullish momentum.
Trend strength: ADX readings above 25 in the cited intraday analysis indicate a relatively strong trend, although ADX alone does not establish direction.
4. Trading Scenarios
🟢 Scenario A: Bullish Trade (BUY)
Entry condition:
Wait for a confirmed breakout above $103.56.
Look for a successful retest of the breakout level.
Potential targets:
TP1: $106.28
TP2: $110.00
TP3: $112.79
Stop-loss idea: Below the confirmed retest low.
Risk: A breakout without strong buying volume could turn into a false breakout.
🔴 Scenario B: Bearish Trade (SELL)
Entry condition:
Watch for rejection near $103.50–$104.00.
Look for a break below $99.13 for stronger bearish confirmation.
Potential targets:
TP1: $96.72
TP2: $94.00
TP3: $91.07
Stop-loss idea: Above the rejection high.
Risk: Strong buying pressure could invalidate the bearish setup.
These are conditional scenarios, not guaranteed price predictions.
5. My Trading Recommendation
Trading Factor Assessment
Short-term direction Bullish
Immediate resistance $103.56
Immediate support $99.13
Buying immediately Risky near resistance
Buying after breakout confirmation Potential opportunity
Selling Wait for bearish confirmation
My preferred approach
I would wait for confirmation rather than enter immediately.
BUY: If SOL breaks above $103.56 and successfully retests the level.
SELL: If SOL fails at resistance and bearish momentum develops.
NO TRADE: If the price continues moving sideways between support and resistance.
The market can move sharply in either direction, so use a stop-loss and avoid excessive leverage.
Note: The analysis uses published market data available on October 28, 2026. Verify the live price and chart before trading.
---
📈 Let me know your trading timeframe
Which timeframe do you trade?
1. 5-minute chart (scalping)
2. 15-minute chart
3. 1-hour chart
4. 4-hour chart
5. Daily chart (long-term)
Tell me your timeframe, and I can provide a more focused SOL/USD entry, stop-loss, and take-profit setup.