



Three of the market's most durable franchises are priced very differently today. Microsoft trades at $524.49 with a $3.89 trillion market cap and a P/E of 29.,1 sitting roughly 5% below its 52-week high of $553.72. Visa is at $408.25, a P/E of 42.8, and only about 1.5% below its 52-week high of $414.60. Alphabet is the outlier: $321.11, a P/E of 16.0, roughly 21% below its 52-week high of $408.61.
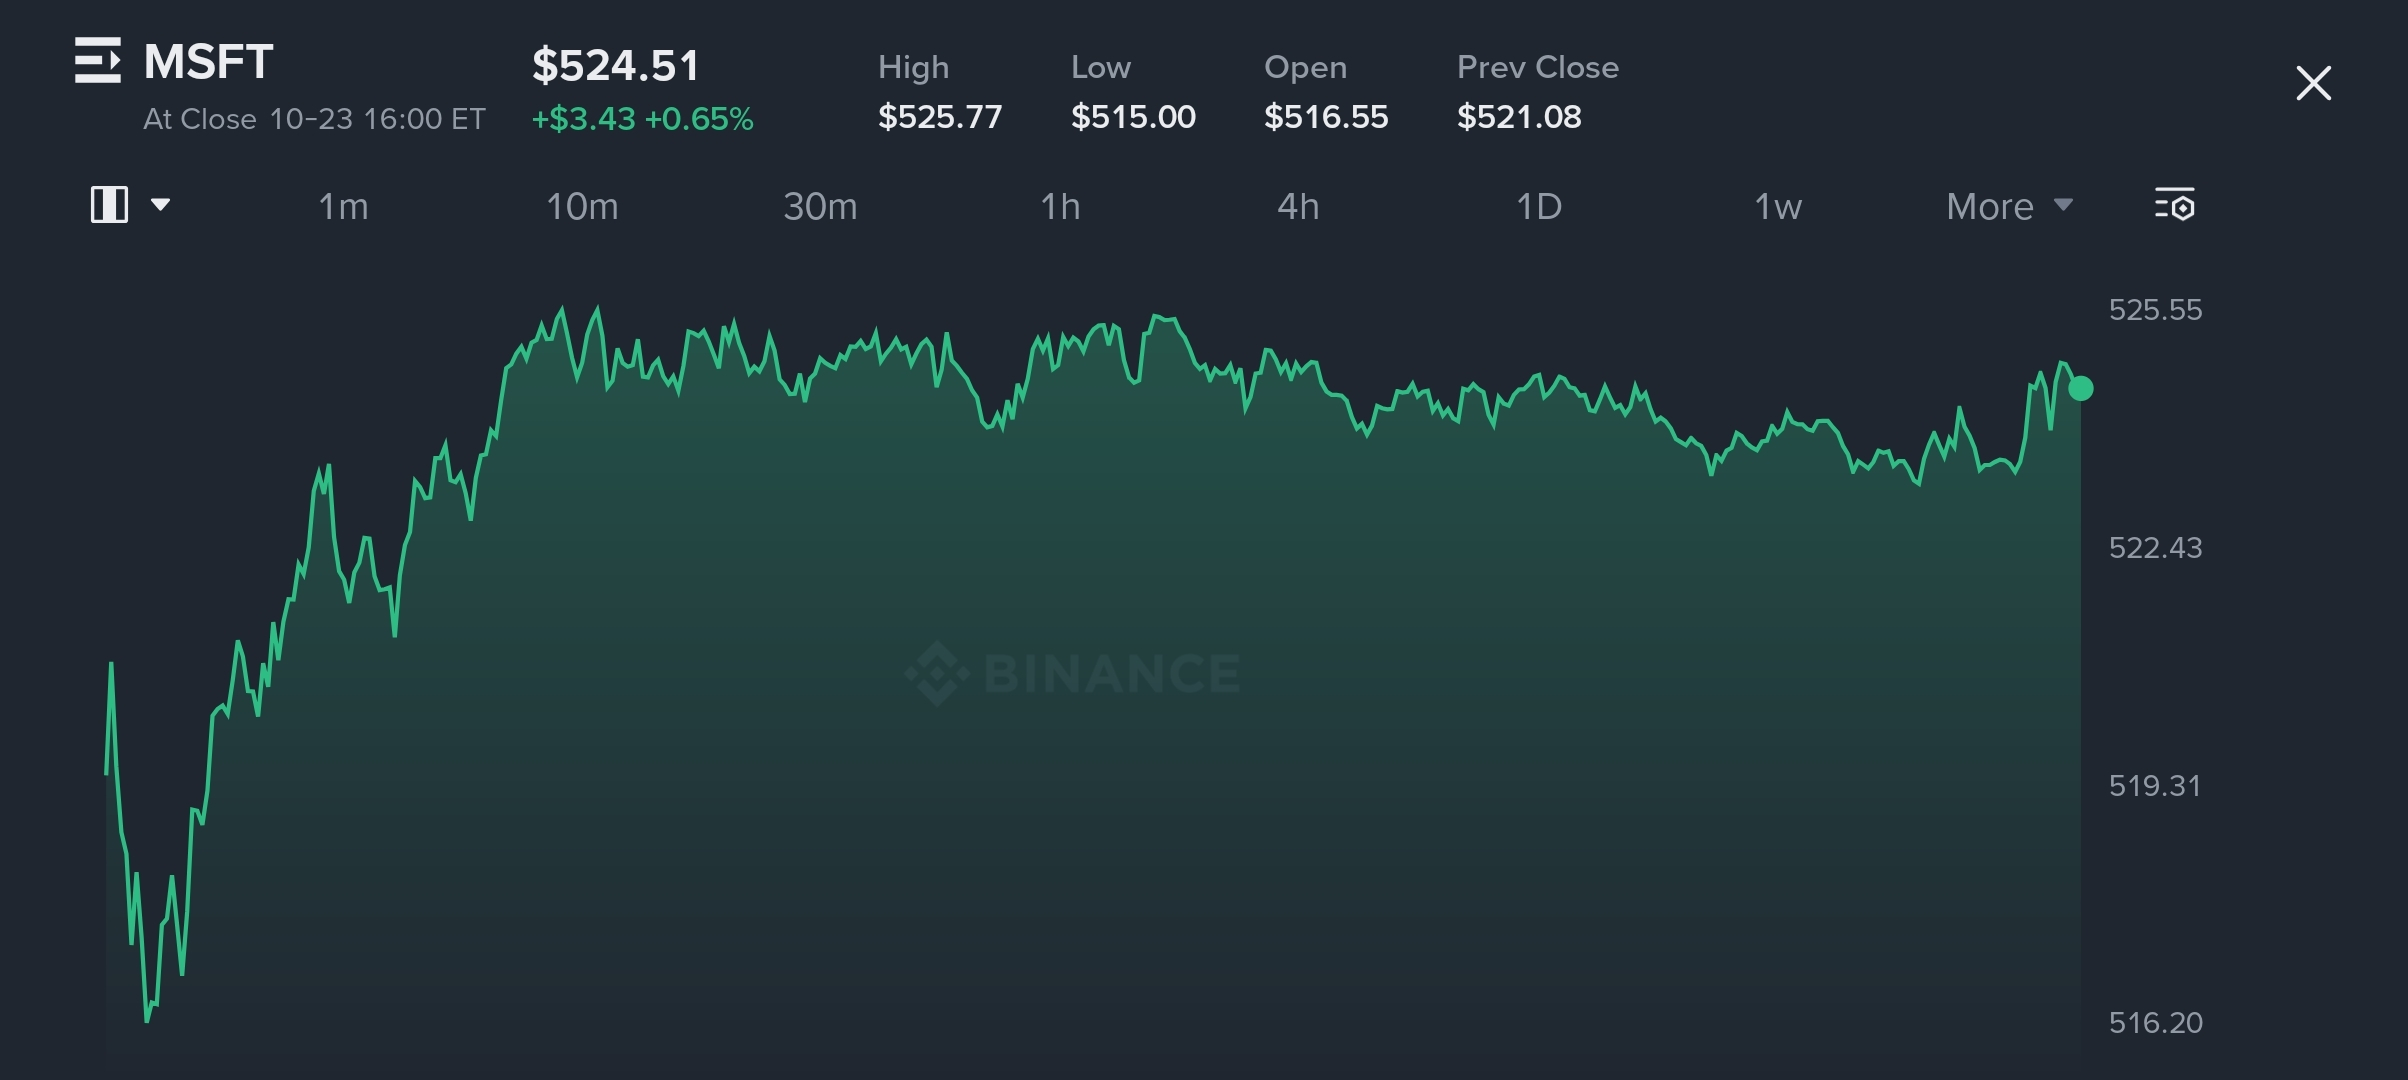

$MSFTB Microsoft is the most balanced of the three. Revenue grew 17.7 year over year, net% income 31.3%, operating margin stands at 45.1%, return on equity at 30.2%, debt-to-equity at just 0.09, and free cash flow at $66.99 billion. There is no obvious structural weakness here — only the question of what is growth already priced in.
Visa remains the quality benchmark. Return on equity is 50.9%, operating margin 59.1%, profit margin 48.4%, and revenue is growing 14.4%. But net income grew only 6.8%, debt-to-equity is 0., and68 a P/E of 42.8 makes it the most expensive of the trio. Its recent strength has been notable: the stock gained about 13% over the past two weeks.
Alphabet is the value case, and the risk case. Return on equity is 38.1% and free cash flow $53.27 billion, yet the shares are down roughly 12% over the past 12 weeks. The overhang is capital intensity: 2026 capex guidance of $195–205 billion, constrained cloud computing capacity, and negative free cash flow of $5.9 billion last quarter. Third-quarter results on 28 October the near-term test.
** areMy view:** for durability, Microsoft; for margins, Visa; for valuation, Alphabet. The differences are less about business quality than about the of risk each kind carries — execution and pricing for Microsoft, multiple compression for Visa, and capital spending for Alphabet. Which one an investor prefers says more about what they are willing to be paid for than about which company is better.
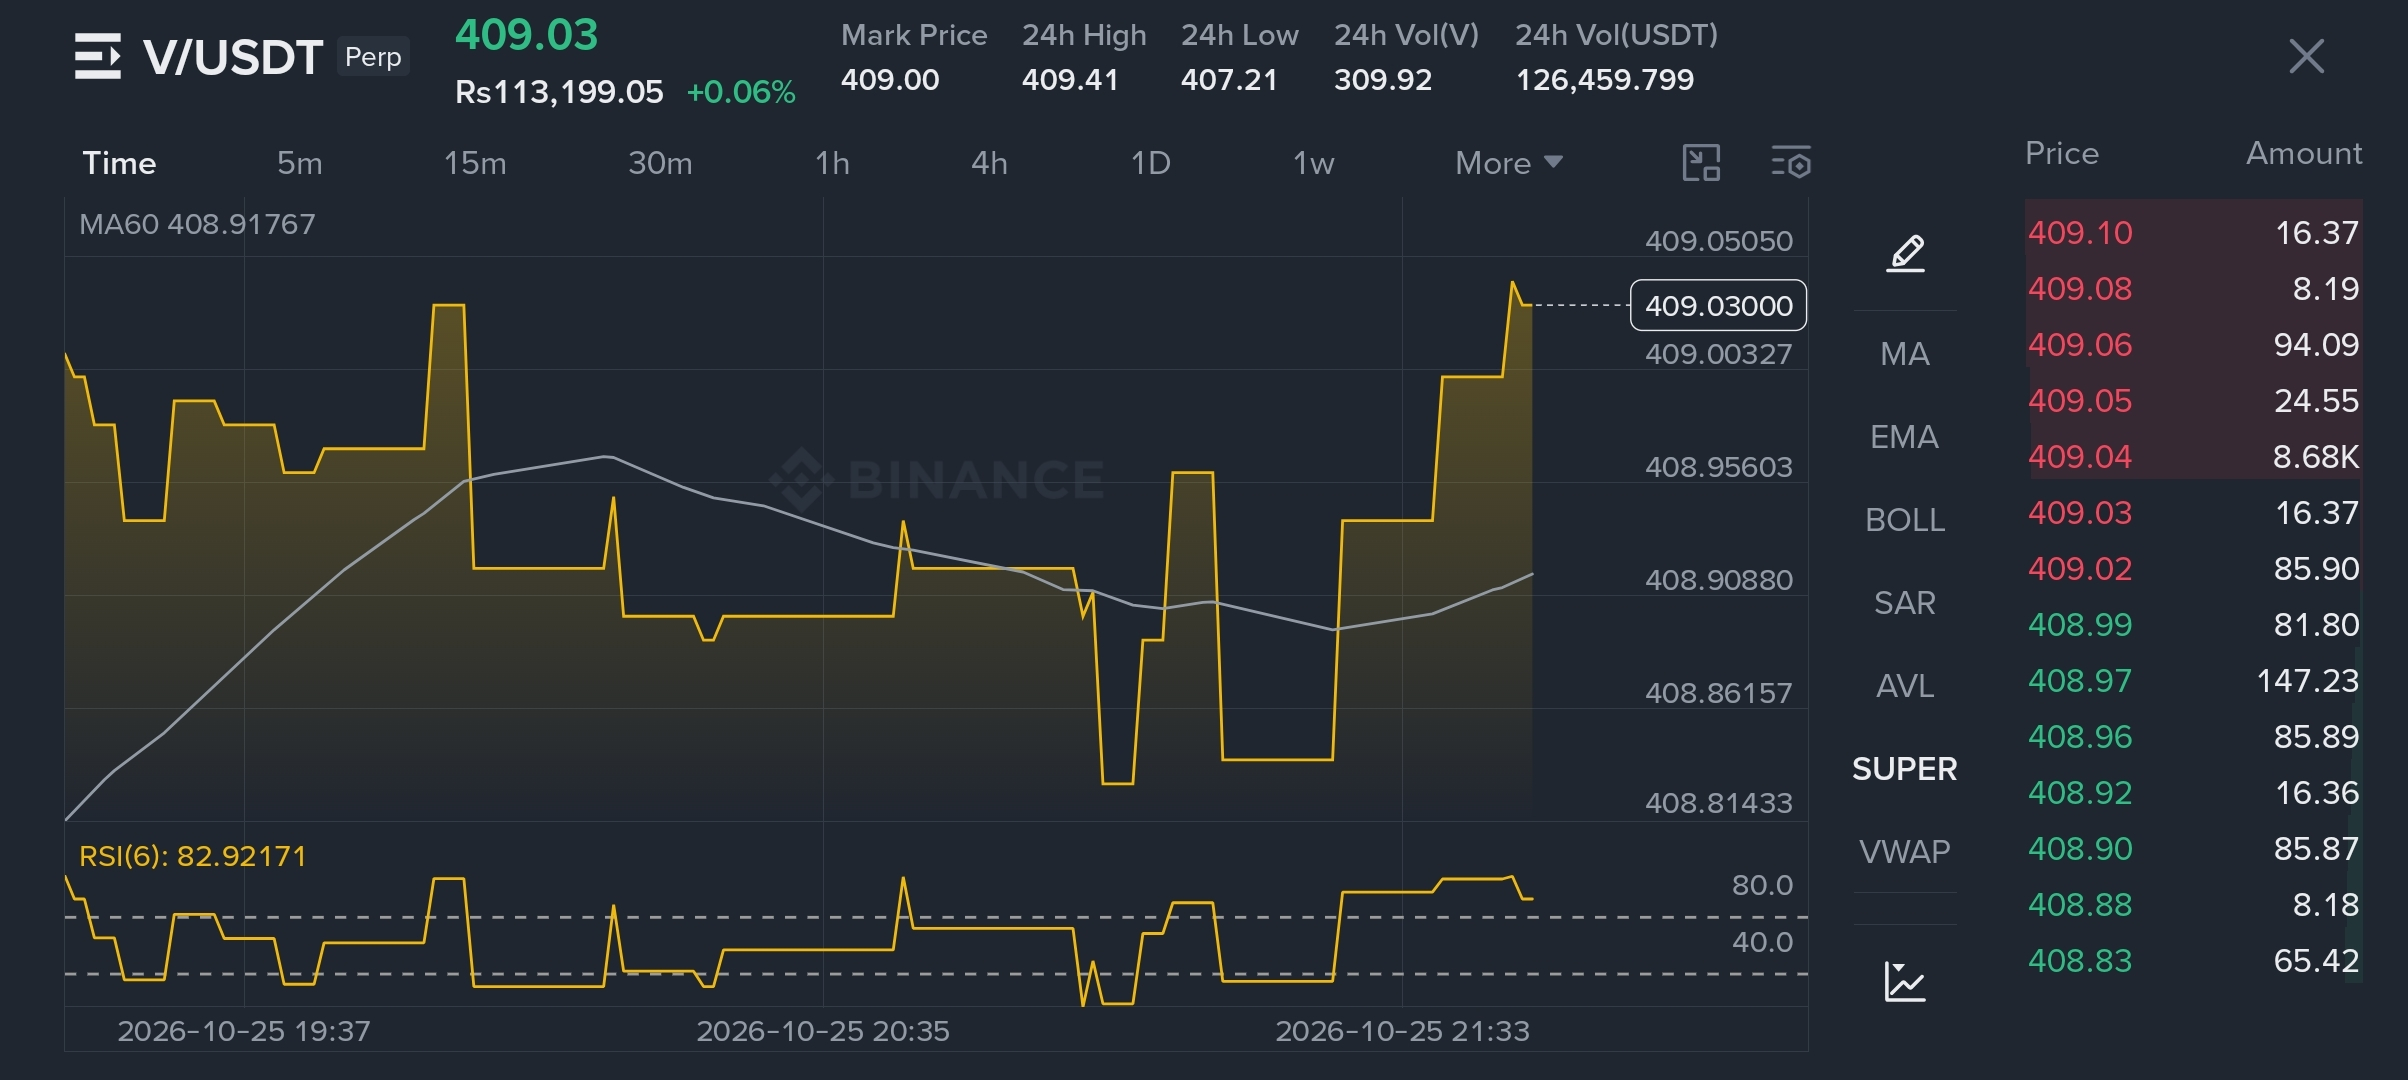

$V.US Current Price: V/USDT Perp is trading at 409.03, showing a marginal gain of +0.06%.
24h Range: The price has moved between a 24-hour high of 409.41 and a low of 407.21.
Moving Average (MA60): The price is currently at 408.91, trading slightly above the MA line, indicating short-term bullish momentum.
RSI (6): The Relative Strength Index is at 82.92, which indicates that the asset is in the overbought zone and could face a potential price correction or sideways consolidation soon.

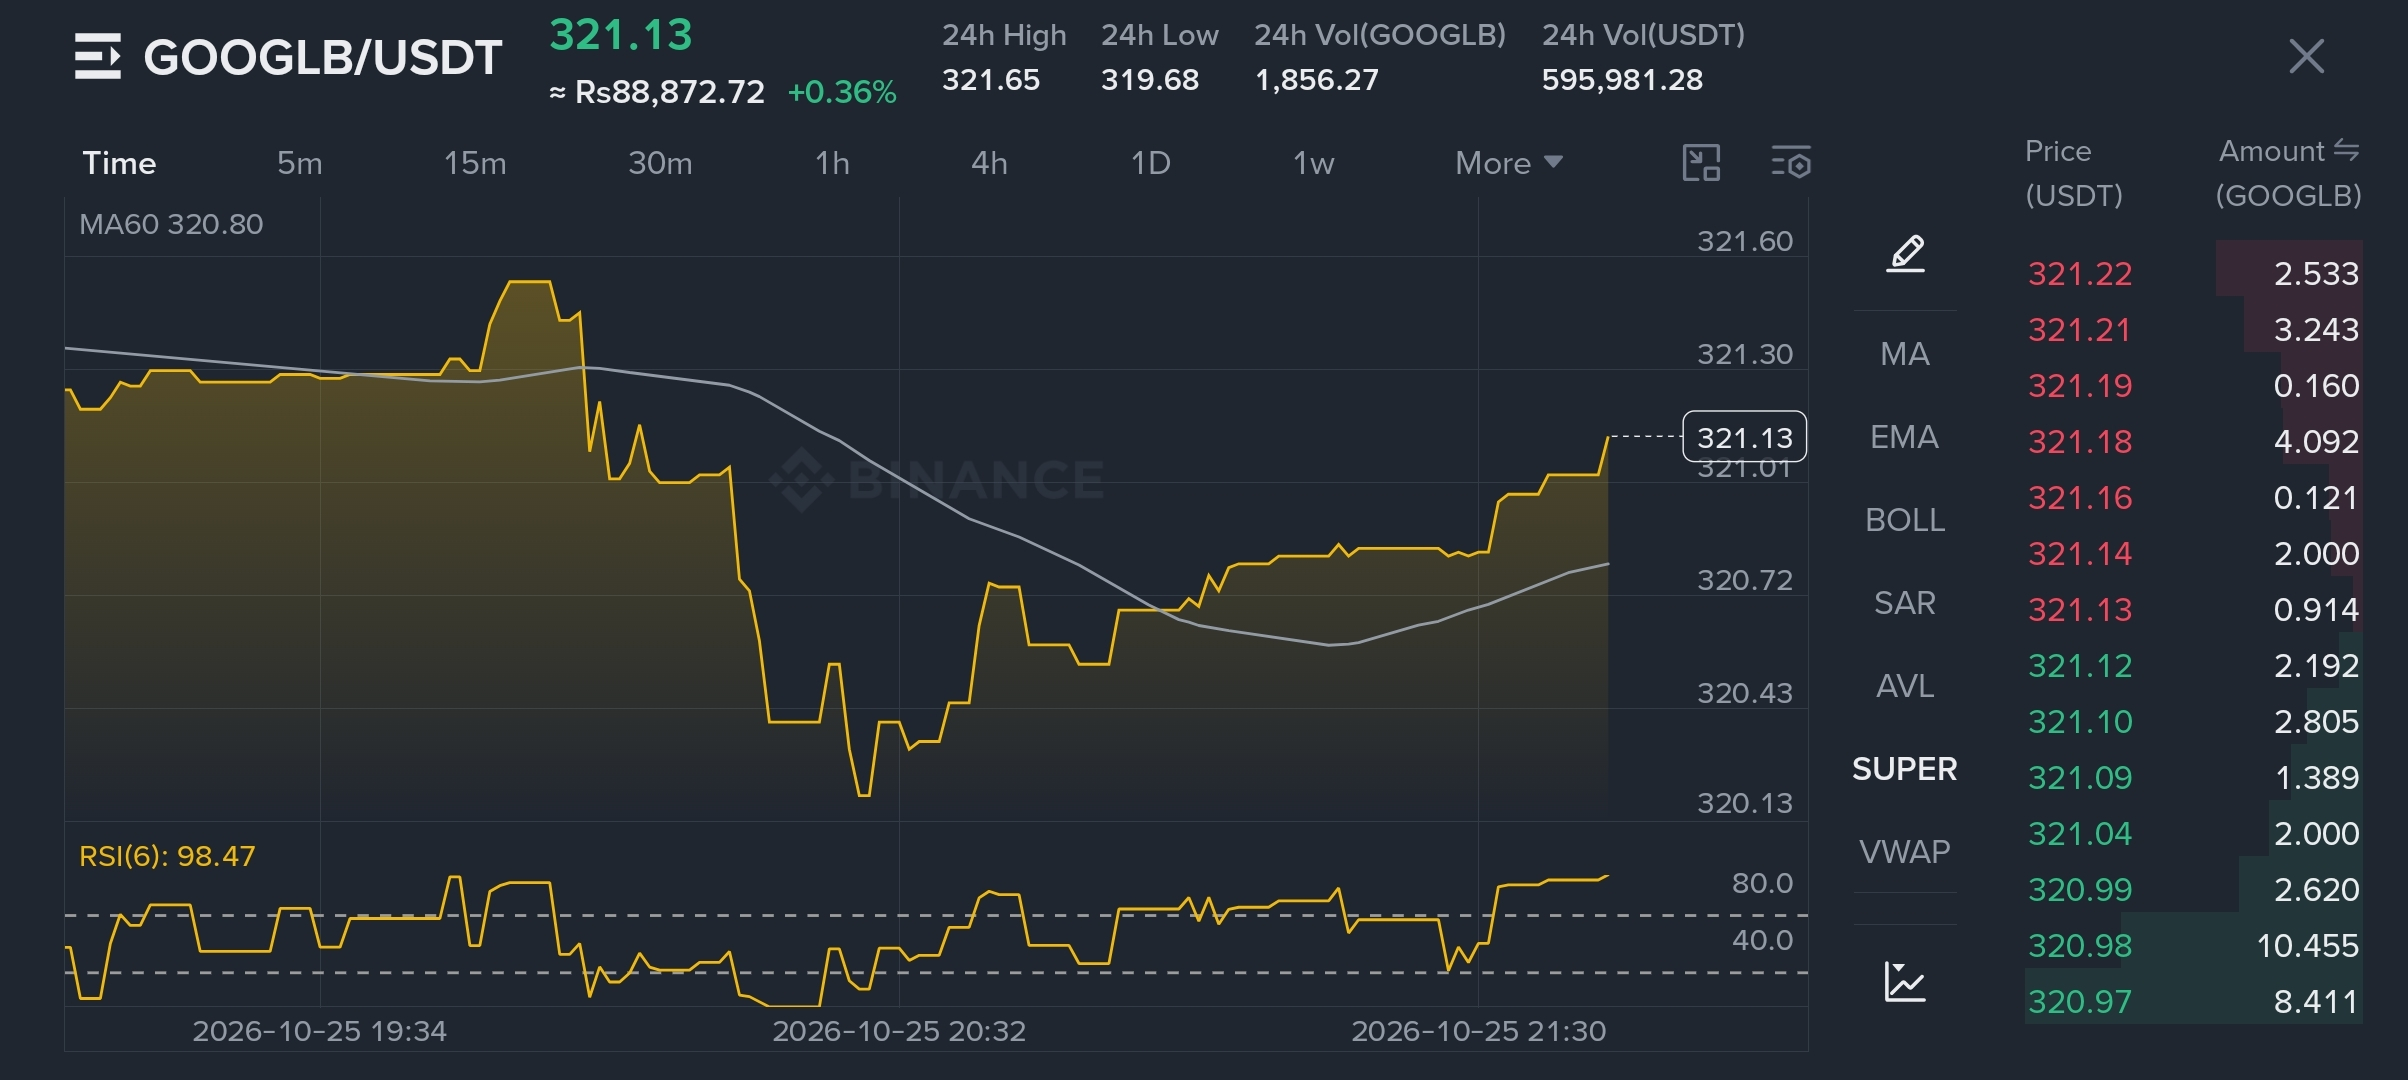
Current Price: $GOOGLB /USDT is trading at 321.13 USDT, showing a minor daily gain of +0.36%.
24h Range: The price has fluctuated between a high of 321.65 and a low of 319.68.
Moving Average (MA): The current price is slightly above the MA60 (320.80), indicating short-term bullish momentum.
RSI (6): The Relative Strength Index is extremely high at 98.47, which places the asset firmly in the overbought zone and suggests a potential price correction or consolidation soon.