

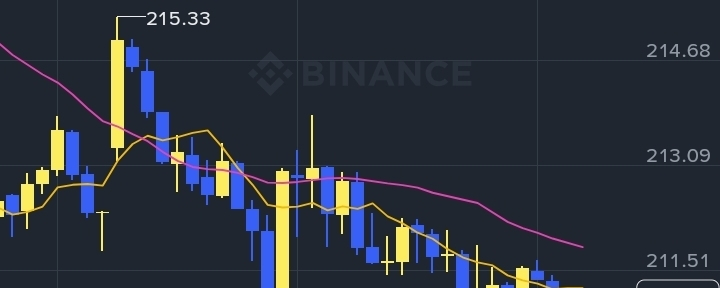

Here is a breakdown of the NVDA chart based on your request:
Hook: The Momentum Shift
After a sharp rejection from the $222 resistance level, NVDA has entered a distinct short-term downtrend. The stock is currently testing critical support near $210, and with the MACD still deep in bearish territory, the immediate question is whether this is a healthy pullback or the start of a deeper correction.
---
K-Line Analysis
Looking at the 1-hour timeframe, the technicals are heavily skewed to the downside, though showing signs of temporary exhaustion:
· Trend & Moving Averages: The price action is bearish. The K-line is trading well below all major short-term moving averages (MA5 at 211.66, MA10 at 212.10, and MA30 at 215.84). The MA lines are fanning out downwards, confirming strong selling pressure. The price recently hit a low of $210.19, which is acting as immediate support.
· Candlestick Patterns: The drop from $222.19 was aggressive and steep. However, the most recent candles near the $210-$211 zone are small and show long lower wicks. This suggests that while sellers are in control, buyers are stepping in at this level to defend the $210 floor.
· MACD Indicator: The MACD (12,26,9) is bearish. The MACD line is below the signal line, and the histogram remains red. However, you can observe that the histogram bars are slowly getting shorter, and the lines are flattening out. This is a classic sign that the downward momentum is decelerating, hinting at a possible short-term consolidation or bounce.
· Key Levels:
· Resistance: Immediate resistance is at the MA lines around $212-$215. A stronger ceiling is the recent high of $222.19.
· Support: The immediate floor is the recent low of **$210.19**. If this breaks, the psychological level of $200 comes into play.
---
Trade Plan
Given the current bearish momentum but potential for a short-term bounce, here are two ways to approach this setup:
Scenario A: Bearish Continuation (Trend Following)
· Trigger: A solid 1-hour candle close below the recent low of $210.19.
· Action: Short (Sell).
· Stop Loss: Place it just above the MA10 (around $213.00) to protect against a fake breakdown.
· Take Profit: Target the psychological level of $205.00** or **$200.00.
Scenario B: Short-Term Rebound (Mean Reversion)
· Trigger: A bullish reversal candle (like a strong engulfing or hammer) forming right at the $210 support, combined with the MACD histogram turning green.
· Action: Long (Buy).
· Stop Loss: Tight stop just below the recent low, around $209.50.
· Take Profit: Target the MA30 line around $215.50. Note: This is a counter-trend trade and carries higher risk.
Fundamental Note: Keep in mind that NVDA is a highly volatile stock. The chart notes earnings aren't until late 2026, so for now, price action will be driven by broader market sentiment (like tech sector rotation or macro news) and its general high-beta nature. Always use strict risk management.