

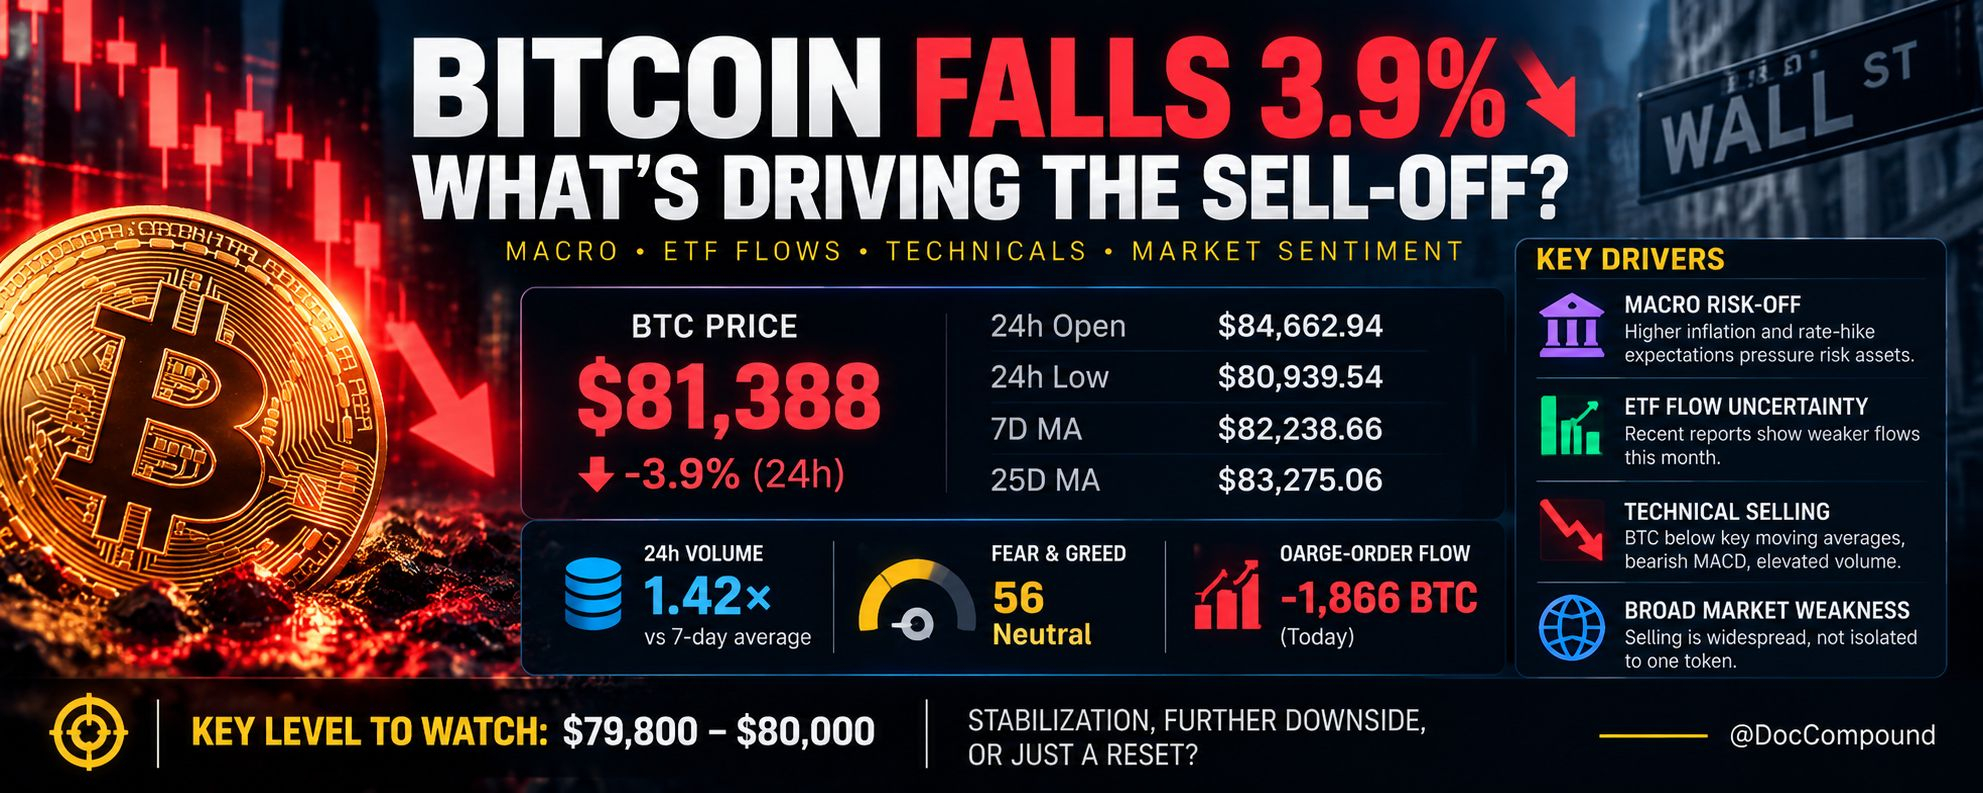

My read: this is a meaningful short-term bearish move, but the supplied data does not yet prove that a deeper market breakdown is underway. The key question is whether the selling is a temporary deleveraging event or the start of a sustained deterioration in demand.
1. What the numbers tell us
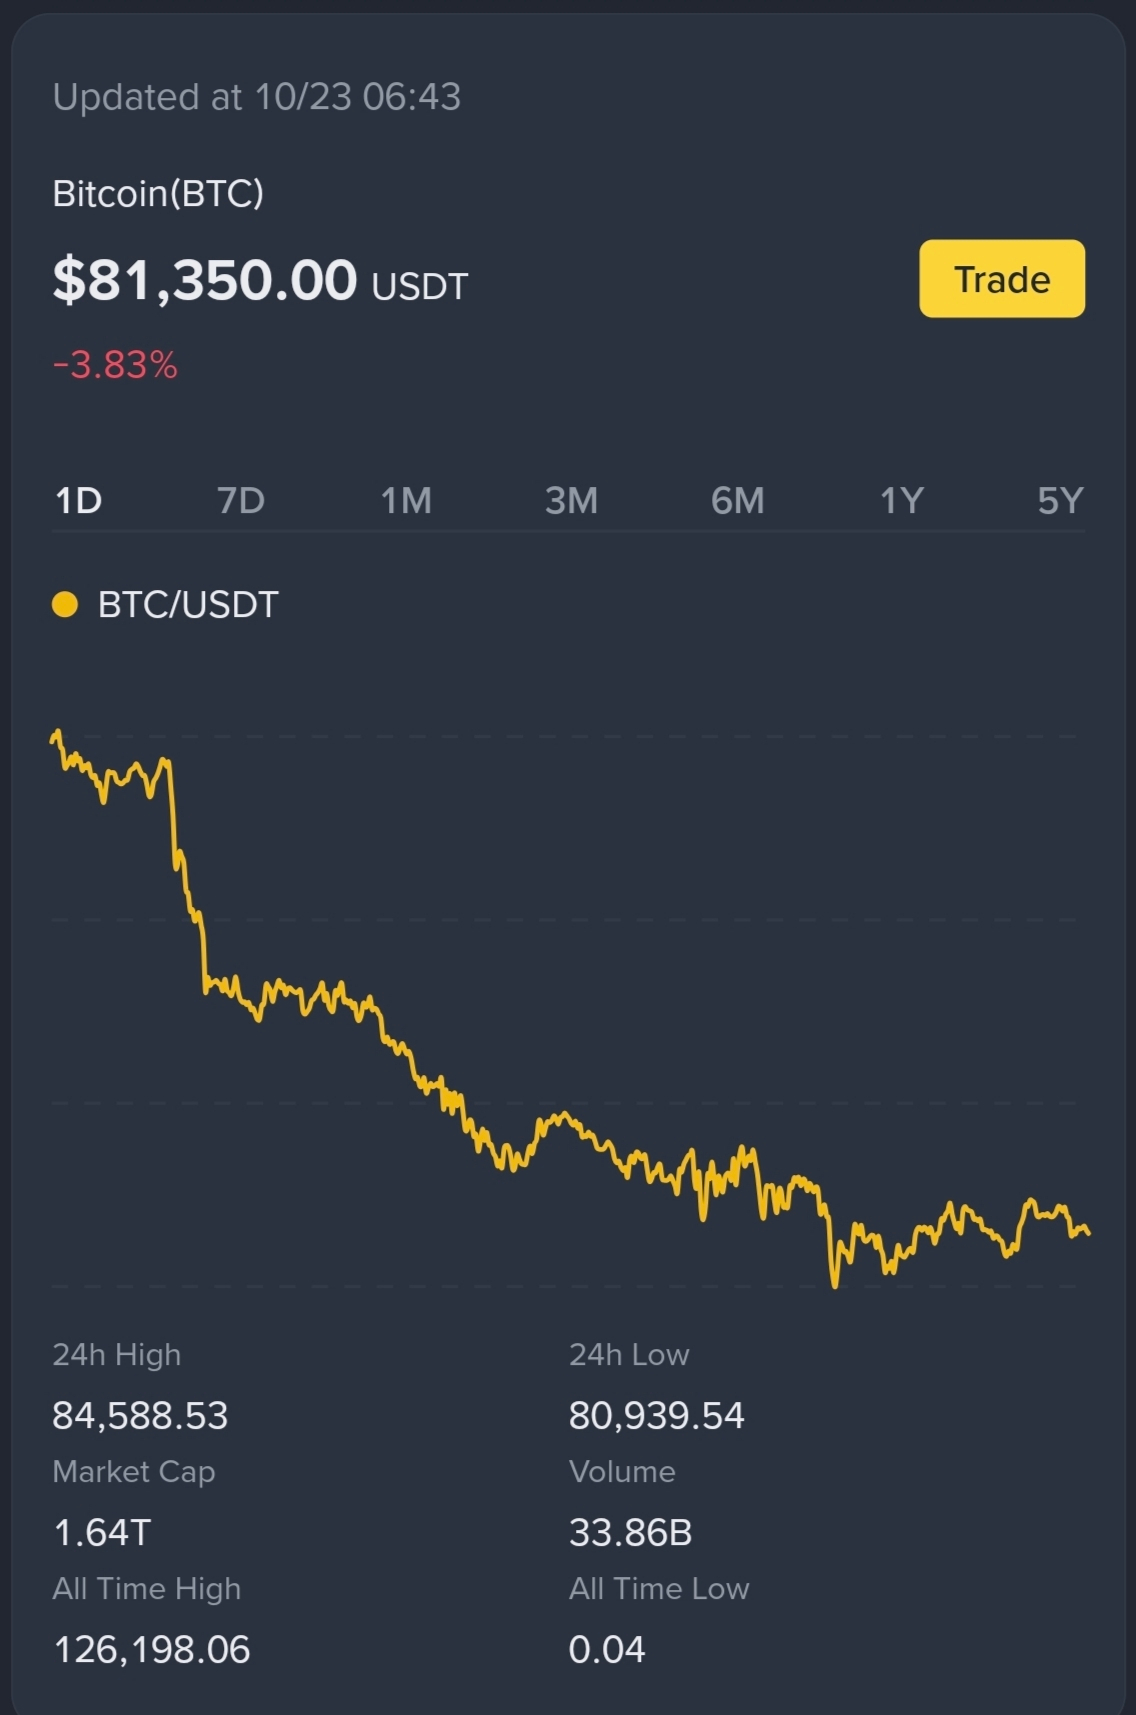
24-hour change: −3.9%
24h open: $84,662.94
24h low: $80,939.54
7-day moving average: $82,238.66
25-day moving average: $83,275.06

Three signals stand out:
* Price is below both moving averages. Short-term momentum is weak, and both averages are now potential resistance levels on a recovery.
* Volume is 1.42× its recent average. The decline has elevated participation. That supports the view that this is more than a quiet drift downward, but volume alone cannot tell us whether the move is capitulation or the beginning of further selling.
* The $79,800–$80,000 area matters. It is a potential support zone in your analysis, not a guaranteed floor. A break below it would increase downside risk; a brief dip below it followed by a strong recovery could instead be a failed breakdown.
2. Are the proposed bearish drivers convincing?
Macro risk-off — plausible
Broader market weakness is consistent with the sell-off. Reporting on October 22 linked declines in crypto and precious metals to volatility in technology stocks and investors moving toward safer assets. That supports the risk-off interpretation, but does not establish that inflation or rate expectations directly caused this particular BTC decline.
Institutional flows — mixed, not uniformly bearish
Bitcoin ETFs reportedly lost about $228 million during October 12–16, but then recorded substantial inflows on October 19–21. One tracker reports roughly $1.1 billion of inflows over those three sessions.
This weakens the argument that declining ETF demand alone explains the October 23 sell-off. ETF inflows can coexist with falling prices when other selling pressure outweighs them.
Technical selling — the clearest signal in your snapshot
BTC below both moving averages, elevated volume, and negative large-order flow collectively suggest sellers currently have the upper hand. But a bearish MACD or a so-called death cross is a lagging signal, not a reliable standalone forecast. The claimed net flow of −1,866 BTC also needs its source and methodology before it can be treated as conclusive.
3. What I would watch next
Bullish stabilization
BTC reclaims approximately $82,240, then $83,275, while selling pressure fades. That would improve the short-term picture, although it would not by itself confirm a new uptrend.
Neutral consolidation
BTC holds around $80,000 but struggles to reclaim its moving averages. This would suggest the market is searching for balance rather than signaling a confirmed recovery.
Bearish continuation
BTC breaks below $79,800–$80,000 and fails to recover the area. That would increase the risk of another leg down, especially if spot selling intensifies and broader risk assets remain weak.
These are conditional scenarios, not price predictions.
4. What this means for an accumulation strategy
The advantage of a long-term accumulator is that we do not need to identify the exact bottom. We just need to avoid turning a long-term plan into an emotional reaction to short-term volatility.
* Do not interpret a 3.9% daily decline as proof that BTC is cheap. A lower price is not necessarily attractive value if the market's underlying conditions are deteriorating.
* Do not automatically sell core holdings because of a bearish technical signal. Your decision should depend on your long-term thesis, portfolio allocation, liquidity needs, and risk tolerance.
* Keep your cash-flow priorities intact. Given your existing financial stabilization plan, do not divert emergency savings or debt-repayment funds into a dip-buying opportunity.
* Separate core accumulation from tactical trading. A trade based on a support break requires explicit risk limits; a long-term holding should follow a different decision framework.
My conclusion: short-term momentum is bearish, but the evidence is mixed on the underlying demand picture. The ETF-flow rebound argues against a simple “institutions are abandoning Bitcoin” explanation. The next useful confirmation would be price behavior around $80,000, accompanied by fresh spot-flow and macro data.