

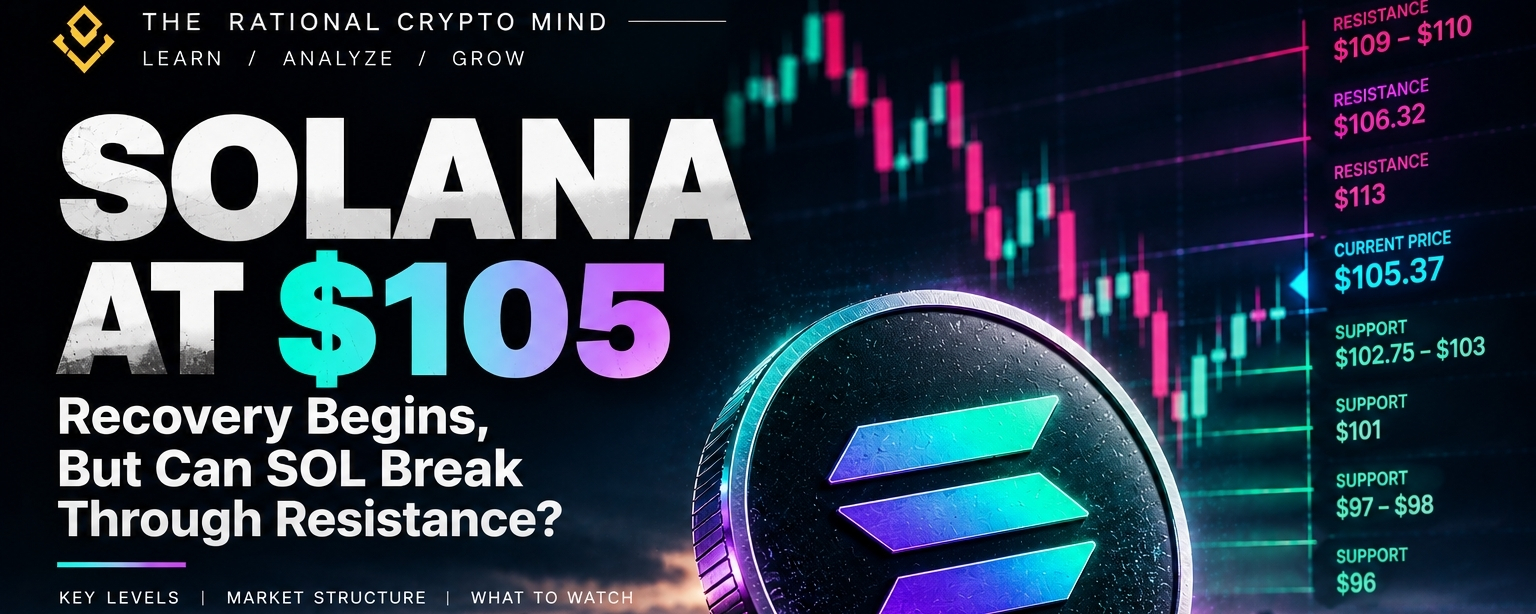

$SOL Solana is showing signs of a short-term recovery, but the market has not yet confirmed a decisive reversal.
After recent selling pressure pushed SOL closer to the psychologically important $100 level, buyers have stepped back in. The rebound is encouraging, but a larger question remains: Is Solana rebuilding momentum, or is this another temporary bounce within a fragile market structure?
The latest available October 19 market snapshots place SOL around $105–$106. Technical indicators show a mixed picture, with some daily signals improving while the shorter-term trend remains vulnerable.
Let's examine the important levels, possible scenarios, and developments worth watching.
1. Market Overview: A Bounce Is Not Yet a Breakout
Solana's recent weakness reflects a broader challenge across the cryptocurrency market: several assets are struggling to sustain recoveries after failing to reclaim previous highs.
SOL's rebound from near $100 suggests that buyers are responding to lower prices. However, the price is approaching a resistance area where renewed selling pressure could emerge.
The latest technical snapshot identifies approximately $106.32 as immediate resistance and $102.76 as nearby support. The market remains volatile, and different chart timeframes are giving different signals.
Three questions now matter:
- Can SOL sustain a move above $106?
- Can buyers defend the $102–$103 region?
- If momentum improves, can Solana reclaim the $109–$110 area?
Until price action provides clearer answers, the recovery should be treated as developing rather than confirmed.
2. Key Solana Price Levels
The following are approximate reference levels from October 19 technical data. They are not guarantees that the price will stop or reverse at these points.
Support zones
- $102.75–$103: The nearest support area in the latest technical snapshot.
- Around $101: A secondary support reference near the psychological $100 level.
- $97–$98: A lower area to monitor if selling pressure returns.
- Around $96: A recent low-region reference highlighted in market commentary.
Resistance zones
- Around $106.30: The first major hurdle for the current rebound.
- $109–$110: A broader resistance region where the recovery may face another test.
- Around $113: A higher technical resistance reference if upward momentum continues.
- Around $120: A larger psychological and technical level that would require a substantially stronger recovery.
Support and resistance are zones, not precise barriers. Prices can move through them temporarily, and a brief breakout does not necessarily indicate a lasting trend change.
3. The Bullish Scenario: Can SOL Reclaim $110?
The bullish case becomes more credible if Solana holds above nearby support and establishes a sustained move above $106.30.
A stronger recovery would ideally include:
1. Higher lows forming on the chart.
2. A sustained move above immediate resistance.
3. Continued buying participation rather than a brief price spike.
4. The ability to hold a reclaimed resistance level during a later pullback.
If these conditions develop, the $109–$110 region becomes the next important area to monitor. A sustained move beyond that zone could bring $113 into focus, with $120 remaining a more distant reference.
However, each step requires confirmation. A move above $106 that quickly reverses would be weaker evidence than a breakout that holds and attracts continued market participation.
4. The Bearish Scenario: Why $100 Still Matters
The bearish scenario strengthens if SOL loses the $102–$103 support area and fails to recover it.
That could bring the $101 region—and then the psychological $100 level—back into focus.
If SOL breaks below $100 and remains weak, the $97–$98 area could become relevant. Further deterioration might reopen a test of the recent low near $96.
A brief dip below support would not automatically confirm a broader breakdown. The duration of the move, trading activity, and ability to reclaim the lost level would all matter.
The important signal is not simply that SOL touches $100. It is whether the market can maintain support or continues to establish lower levels.
5. Technical Indicators: Why the Timeframe Matters
One of the most interesting features of the latest Solana analysis is the difference between short-term and daily signals.
The October 19 technical snapshot shows:
- The daily outlook has some bullish signals, including positive readings from several trend and momentum measures.
- The shorter-term four-hour outlook remains considerably weaker.
- The daily RSI is around 42, which indicates that momentum is still below the neutral midpoint of 50.
- The market is described as choppy, with elevated volatility.
These signals do not necessarily contradict one another.
A market can rebound over a day while remaining weak over shorter intervals. Similarly, a positive daily signal does not guarantee that the next session will continue higher.
This is why technical indicators should be interpreted together rather than selecting whichever reading supports a preferred prediction.
6. The Bigger Picture: Solana's Network Still Matters
SOL's market price is only one part of the story. Developments across the Solana ecosystem can also influence market attention and longer-term sentiment.
Network upgrades: Market participants are watching the planned Alpenglow-related developments around October 21. Upgrade progress can matter for network performance and reliability, but a technical milestone does not guarantee an immediate price reaction.
Broader crypto sentiment: Solana remains sensitive to Bitcoin and wider market conditions. A stronger overall crypto market may support SOL, while renewed risk aversion could weigh on it.
Liquidity and derivatives positioning: Sharp moves can be amplified when markets are volatile and derivatives positions are crowded. A rebound may partly reflect the unwinding of positions rather than a fundamental change in demand.
Ecosystem activity: Network usage, developer activity, application growth, and reliability are important context for understanding Solana beyond short-term price fluctuations.
These factors should be evaluated separately. A positive network development does not automatically mean the market price must rise, just as a short-term price decline does not by itself establish that the ecosystem is weakening.
7. What Should We Watch Next?
Rather than relying on a single forecast, consider how the market behaves around the following levels.
Market development| Possible interpretation
$SOL SOL holds above $102.75–$103| Near-term support remains intact
SOL sustains a move above $106.30| Recovery gains technical confirmation
SOL reclaims $109–$110| Stronger upward momentum may be developing
SOL loses $101–$100| Downside pressure increases
SOL falls below $97–$98 and remains weak| The recovery structure deteriorates further
These are conditional market scenarios, not guaranteed outcomes or trading instructions.
Final Verdict: Cautiously Neutral
Solana is attempting to recover, but the market still needs to demonstrate that buyers can overcome resistance and maintain support.
The bullish case improves if SOL sustains a move above $106.30 and subsequently challenges the $109–$110 region.
The bearish case strengthens if SOL loses the $102–$103 area and fails to hold the psychological $100 level.
Until one scenario receives clearer confirmation, a cautiously neutral outlook remains reasonable.
The key lesson is simple: a rebound shows that buyers have returned, but a sustained recovery requires evidence that they can keep control.
Your Take
Can $SOL Solana reclaim $110, or will the $100 level be tested again?
Which factor do you think matters most right now: technical structure, Bitcoin's direction, derivatives positioning, or Solana's network developments?
Share your analysis in the comments.
Disclaimer: This article is for educational and informational purposes only. It is not financial advice or a recommendation to buy or sell any cryptocurrency. Crypto markets are volatile, and technical levels can change rapidly.

#Solana #SOL #SolanaAnalysis #CryptoMarket #TechnicalAnalysis #CryptoEducation #TheRationalCryptoMind