



1. Current Overview & Key Levels
Current Price: $81,575.13 (down ~0.68% on the session).
Recent Peak / Resistance: Bitcoin recently rallied to a local high near $87,395.67, but encountered selling pressure and pulled back.
Immediate Support / Pivot Level: The market is testing an intermediate support level around $81,500 – $83,169.
Major Support Levels below:
$77,700 – Secondary support level during recent consolidations.
$71,266 – $72,230 – Key orange dashed support zone representing the breakout baseline prior to the major rally.
2. Technical Indicators Analysis
MACD (Moving Average Convergence Divergence):
MACD Line / Signal: The DIF (110.96) is currently below the DEA (626.00), producing a negative MACD value (-515.03).
Histogram: Red bars indicate a bearish crossover on the daily timeframe, signalling short-term losing momentum after the push toward $87.3k.
Volume:
Volume spiked during the initial expansion phase (from the 62.5k bottom), but daily volume has normalized during this pullback/consolidation phase (13.2K \text{ BTC} over 24h).
3. What to Expect Over the Next Days & Weeks
Short-Term Outlook (Next Few Days)
Consolidation or Slight Pullback: With the daily MACD turning bearish, price action is likely to remain in a range or experience mild downward pressure in the near term.
Key Range to Watch:
If buyers hold the $80,800 – $81,500 area, BTC could bounce back toward the $83,170 – $85,000 resistance zone.
If $80,800 breaks down on daily volume, a quick drop toward the $77,700 level is expected.
Medium-Term Outlook (Next Few Weeks)
Bullish Scenario (Re-test of Highs):
If the market stabilizes above $77,700–$81,500 and the MACD histogram begins curving back upward, Bitcoin could attempt another breakout above $87,395, opening the path toward psychological targets around $90,000.
Bearish / Deeper Correction Scenario:
A breakdown below $77,700 would suggest a deeper correction back toward the major retest line at $71,266 – $72,230, which served as the major breakout structure. A hold at $71.2k–$72.2k would maintain the overall macro uptrend structure.
Key Takeaway Action Plan
Watch the $80,800 - $81,500 zone: Daily closes below this level signal a shift toward $77.7k.
Monitor MACD momentum: Wait for the MACD histogram to flip green or flatten out to confirm seller exhaustion before anticipating $BTC 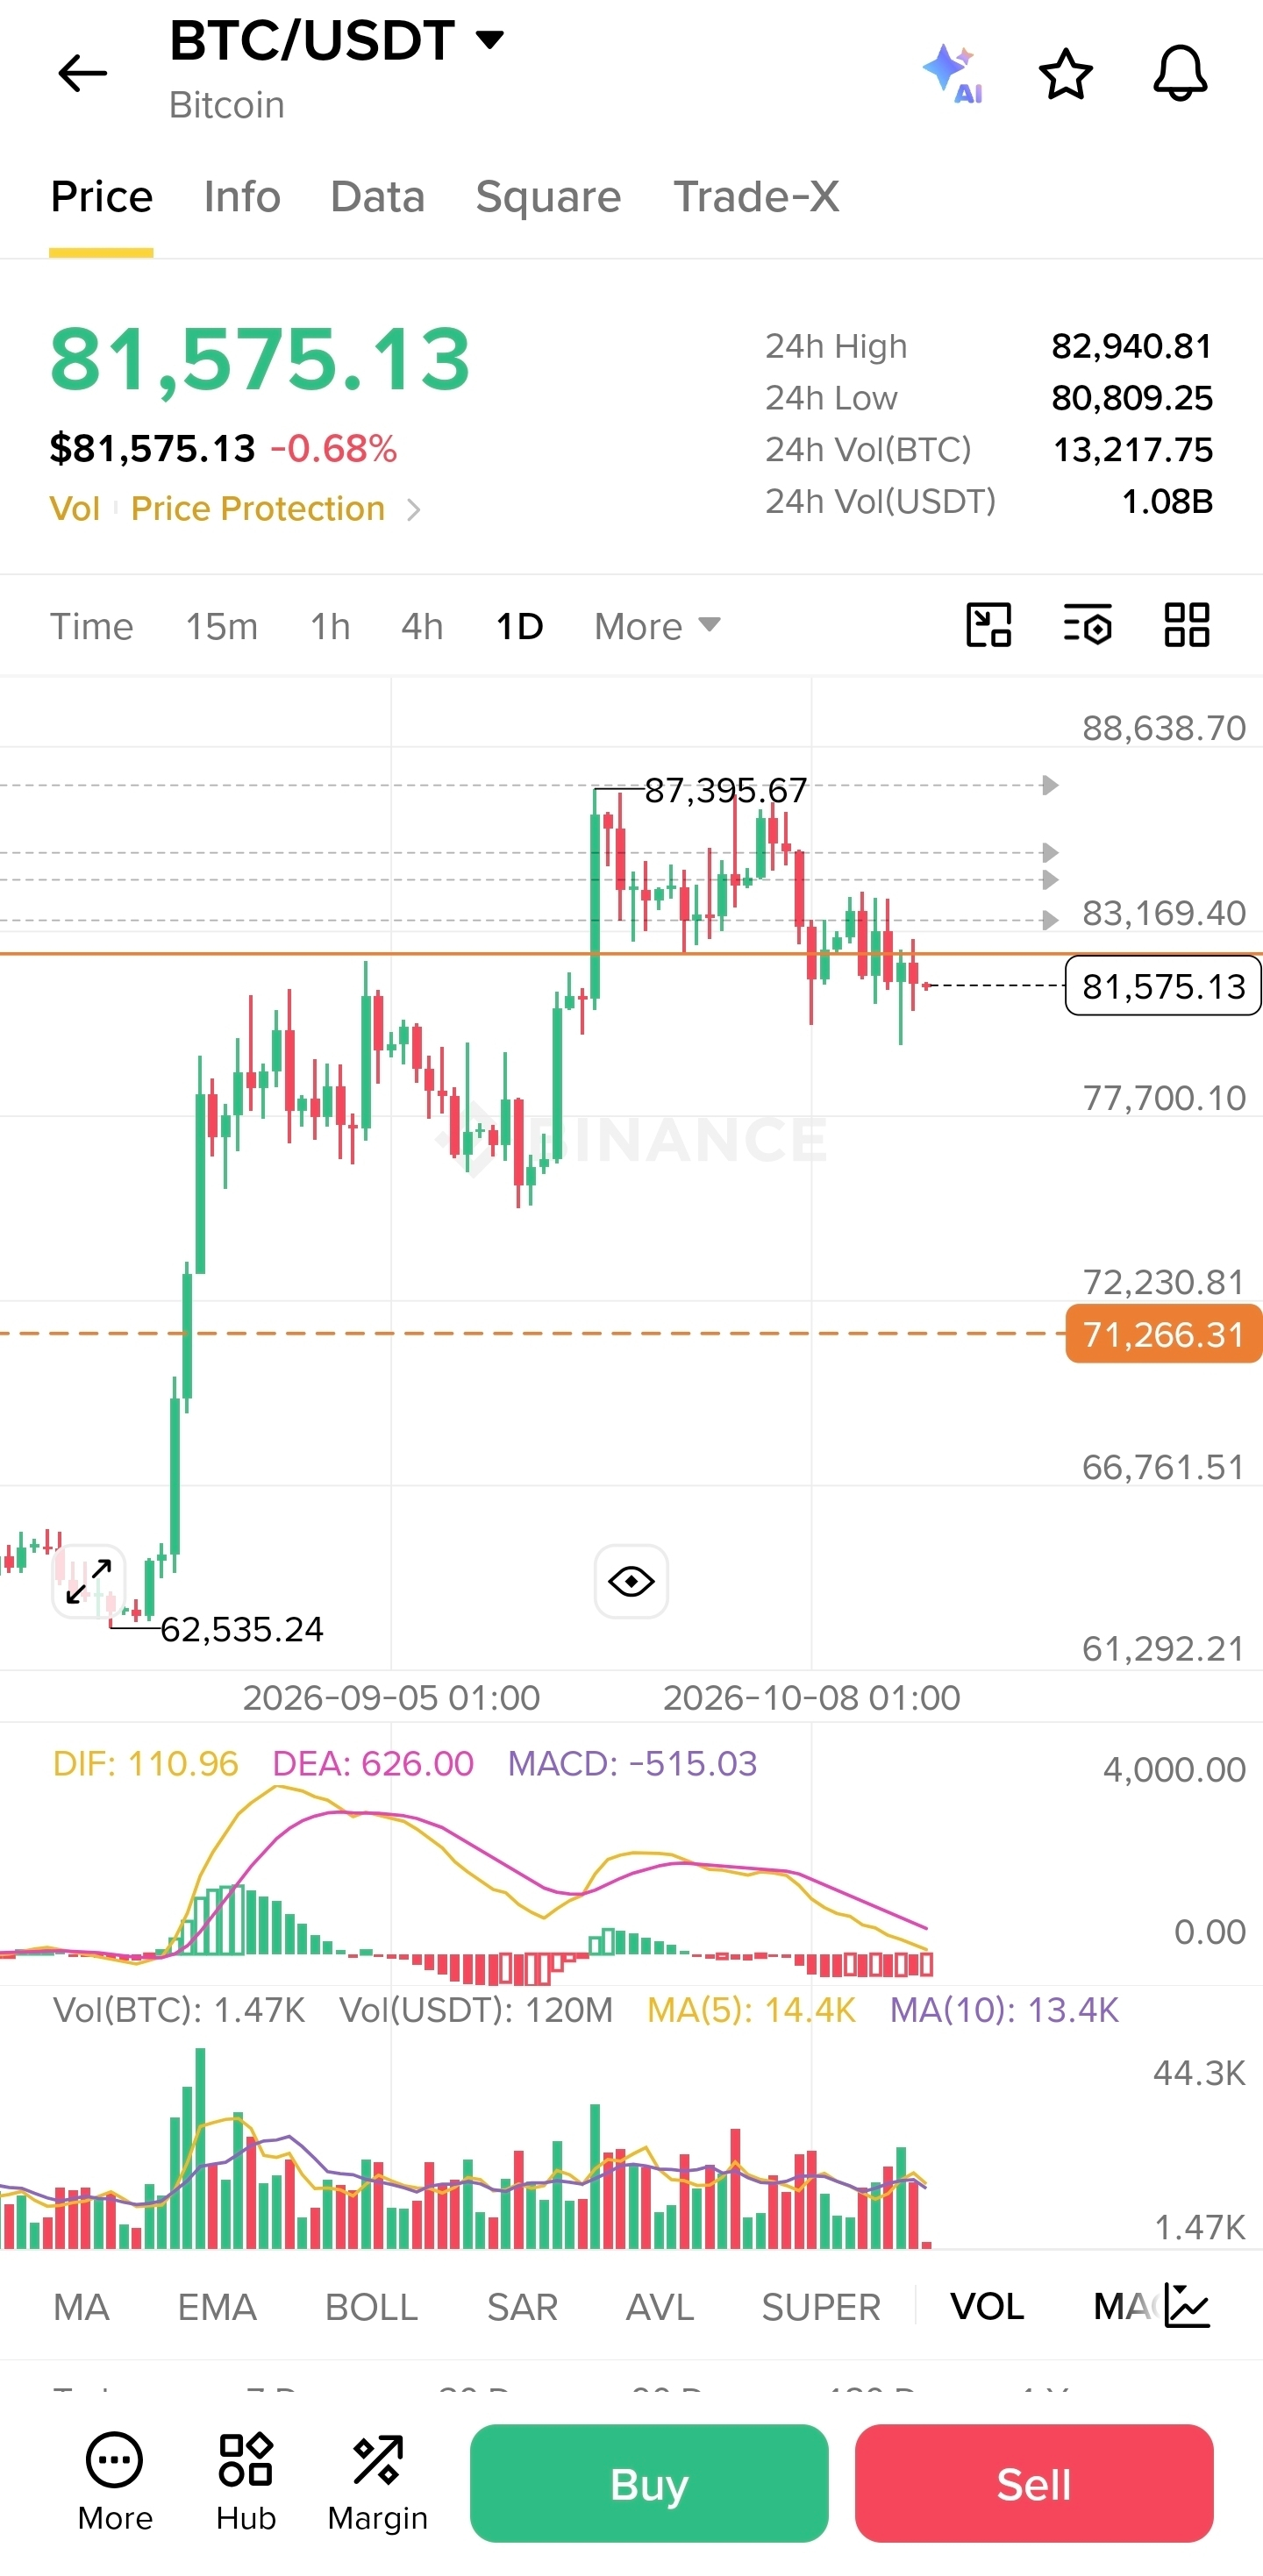 $a move back toward $87.4k. $BTC
