

This analysis focuses on the current BTCUSD market structure, with particular attention to liquidity behavior, Fair Value Gaps (FVGs), order blocks, and potential downside continuation.
Market Structure
Bitcoin has shown a shift from bullish price action into a bearish structure after rejecting the major resistance zone around 86,700–87,100. Following this rejection, price moved lower and formed a series of bearish structural shifts, indicating increasing selling pressure.
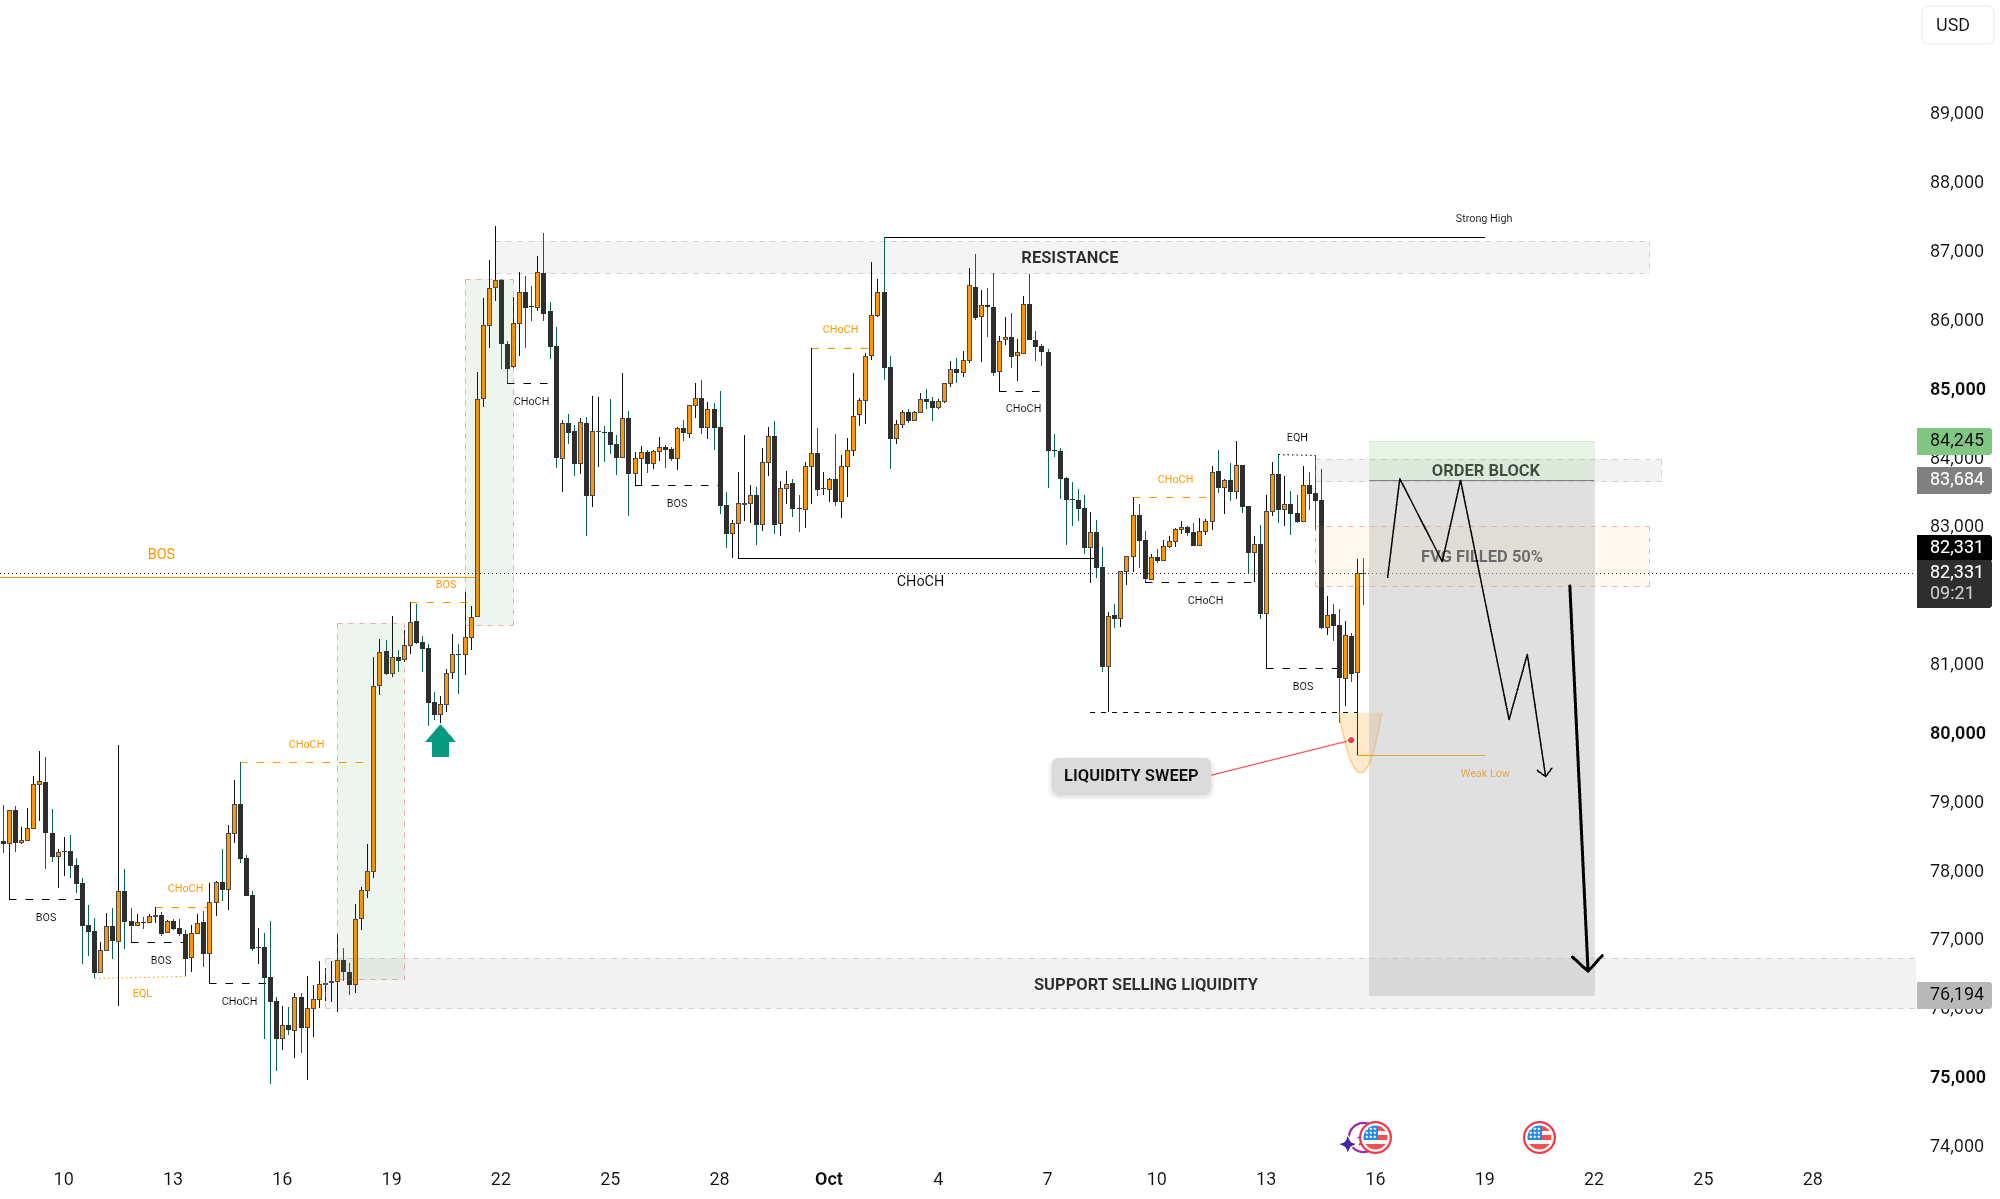
The recent price action around 79,800–80,000 highlights an important liquidity area. Price briefly moved below the previous low before recovering, suggesting a potential liquidity sweep. However, a liquidity sweep alone does not confirm a bullish reversal. Further price action is required to determine whether buyers can establish control or sellers will continue the prevailing bearish move.
Liquidity Sweep & Current Reaction
The marked liquidity sweep near the recent low is an important area to monitor. Price has reacted upward from this region and is currently trading around the 82,200–82,300 area.
This recovery may allow price to retrace into nearby imbalance and supply zones before the next directional move develops. The key question is whether this upward movement represents a temporary pullback within the bearish structure or the beginning of a stronger recovery.
Confirmation through market structure and price displacement will be important before drawing a firm conclusion.
Fair Value Gap (FVG)
The chart highlights a Fair Value Gap around 82,300–83,000, with the 50% level identified as an important reference.
Price may revisit this imbalance during a retracement. The reaction within this zone could provide useful information about the strength of buyers and sellers.
A clear rejection from the FVG, followed by bearish displacement and a break of internal structure, would support the bearish continuation scenario. Conversely, a strong bullish move through the zone could weaken the immediate bearish outlook.
Order Block & Resistance
The marked order block around 83,600–84,200 represents an important potential reaction area above the current price.
If price retraces into this zone, I would monitor whether sellers defend the area through rejection, bearish displacement, or a change in internal structure.
A failure to hold below the order block, followed by sustained acceptance above it, could indicate that the market is developing a stronger recovery. Therefore, this zone should be evaluated through actual price behavior rather than treated as an automatic selling point.
Potential Bearish Scenario
The projected path illustrates a possible bearish continuation scenario.
Price may first retrace toward the FVG or the order block, potentially collecting nearby liquidity before sellers regain control. If bearish confirmation develops, price could revisit the recent low around 79,800–80,000.
A decisive break below that low could expose the next significant downside liquidity region around 76,200–76,700, which is marked on the chart as a potential support and liquidity area.
This scenario remains conditional. The market may instead consolidate, sweep liquidity in either direction, or invalidate the bearish outlook through a confirmed bullish structural shift.
Key Levels to Monitor
83,600–84,200: Order block and potential resistance.
82,300–83,000: FVG and 50% imbalance area.
79,800–80,000: Recent low and liquidity sweep region.
76,200–76,700: Lower support and potential liquidity target.
86,700–87,100: Major resistance and previous high area.
Confirmation & Invalidation
For bearish continuation, I would look for a confirmed rejection from the FVG or order block, followed by bearish displacement and a break of relevant internal structure.
If price instead breaks above the order block and establishes sustained bullish structure, the bearish continuation scenario would need to be reassessed.
Likewise, if the recent low holds and price forms a series of higher highs and higher lows, the possibility of a broader recovery would increase.
Conclusion
BTCUSD is currently showing a bearish market structure after rejecting the major resistance area. The recent liquidity sweep near 79,800–80,000 has produced an upward reaction, while the FVG around 82,300–83,000 and the order block around 83,600–84,200 remain important areas to monitor.
The primary focus is whether price retraces into these zones and produces bearish confirmation or breaks above them and shifts its internal structure. A confirmed breakdown below the recent low could expose the 76,200–76,700 liquidity region.
The projected path represents a technical scenario based on market structure and liquidity, not a guaranteed prediction. Patience, confirmation, disciplined execution, and appropriate risk management remain essential.
Disclaimer: This analysis is provided for educational purposes only and does not constitute financial advice. All market scenarios are subject to change. Always conduct your own research and manage risk responsibly.