

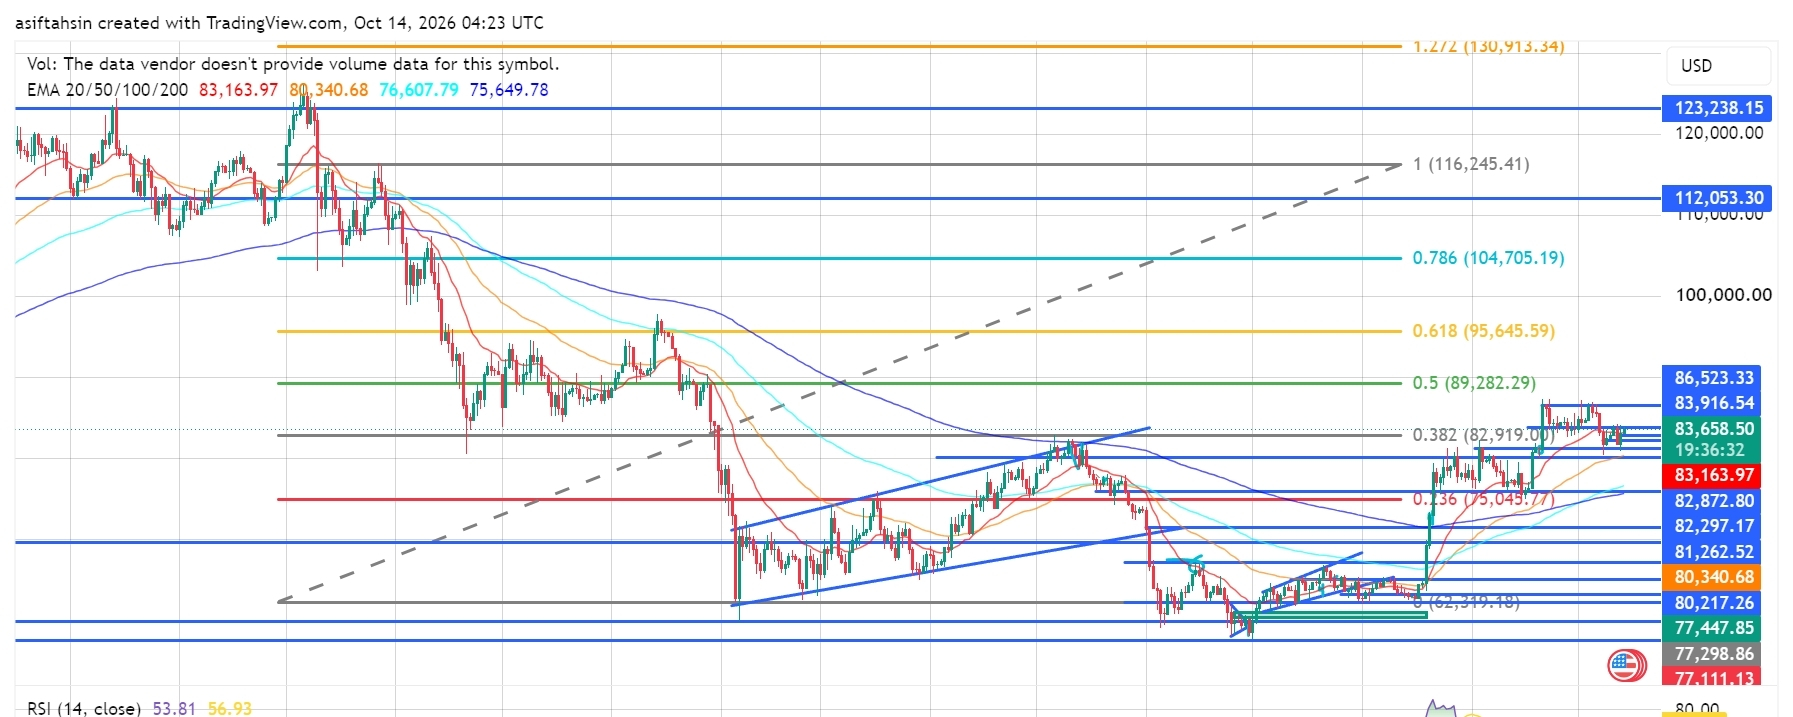

BTC is currently trading around $83,658, holding above the $82,872–$82,919 support region after a strong recovery from the June low near $77,111–$77,448.
The broader recovery structure remains constructive, with BTC trading above its 50, 100 and 200 EMAs while consolidating near the 20 EMA. However, price remains below the $83,916–$86,523 resistance zone. A sustained breakout above this area could bring higher Fibonacci levels into focus.
📈 EMA Structure
20 EMA: $83,163.97
50 EMA: $80,340.68
100 EMA: $76,607.79
200 EMA: $75,649.78
BTC is trading slightly above the 20 EMA and well above the 50, 100 and 200 EMAs.
This positioning supports the broader recovery structure, although the 20 EMA near $83,164 remains an important short-term level to defend.
The $82,872–$82,919 region is particularly important for maintaining the current structure. Holding above it could support another attempt toward the upper resistance zone.
📐 Fibonacci Levels
0.236: $75,045.77
0.382: $82,919.00
0.5: $89,282.29
0.618: $95,645.59
0.786: $104,705.19
1.0: $116,245.41
1.272: $130,913.34
BTC has recovered above the 0.382 Fibonacci level at $82,919 and is now consolidating above this important reference point.
The next major Fibonacci resistance is the 0.5 level at $89,282.29. Before reaching it, BTC needs to reclaim the immediate resistance zone around $83,916–$86,523.
🟢 Bullish Scenario
Immediate resistance is around $83,916.54, followed by the major resistance at $86,523.33.
A clean breakout and sustained move above $86,523.33 could open the path toward:
🎯 $89,282.29
🎯 $95,645.59
🎯 $104,705.19
🎯 $112,053.30
🎯 $116,245.41
A successful breakout and retest of the $83,916–$86,523 region would strengthen the continuation structure.
If BTC reclaims $89,282 and holds above it, the next Fibonacci resistance at $95,645 could become the next major target.
🔴 Pullback Scenario
Key support levels:
$83,163.97 — 20 EMA
$82,872.80
$82,919.00 — 0.382 Fibonacci
$82,297.17
$81,262.52
$80,340.68 — 50 EMA
$80,217.26
$77,447.85
$77,298.86
$77,111.13
The $82,872–$82,919 region is particularly important.
Holding above this zone keeps the current recovery structure intact. A sustained break below $82,297–$81,262 would weaken short-term momentum and could bring the $80,340–$80,217 support region into focus.
If BTC loses the $80,217 region, a deeper retest toward $77,447–$77,111 becomes possible.
🧠 Market Structure & Liquidity
Liquidity Sweep → Accumulation → Higher Lows → Breakout → EMA Reclaim → Expansion → Retest → Consolidation → Continuation
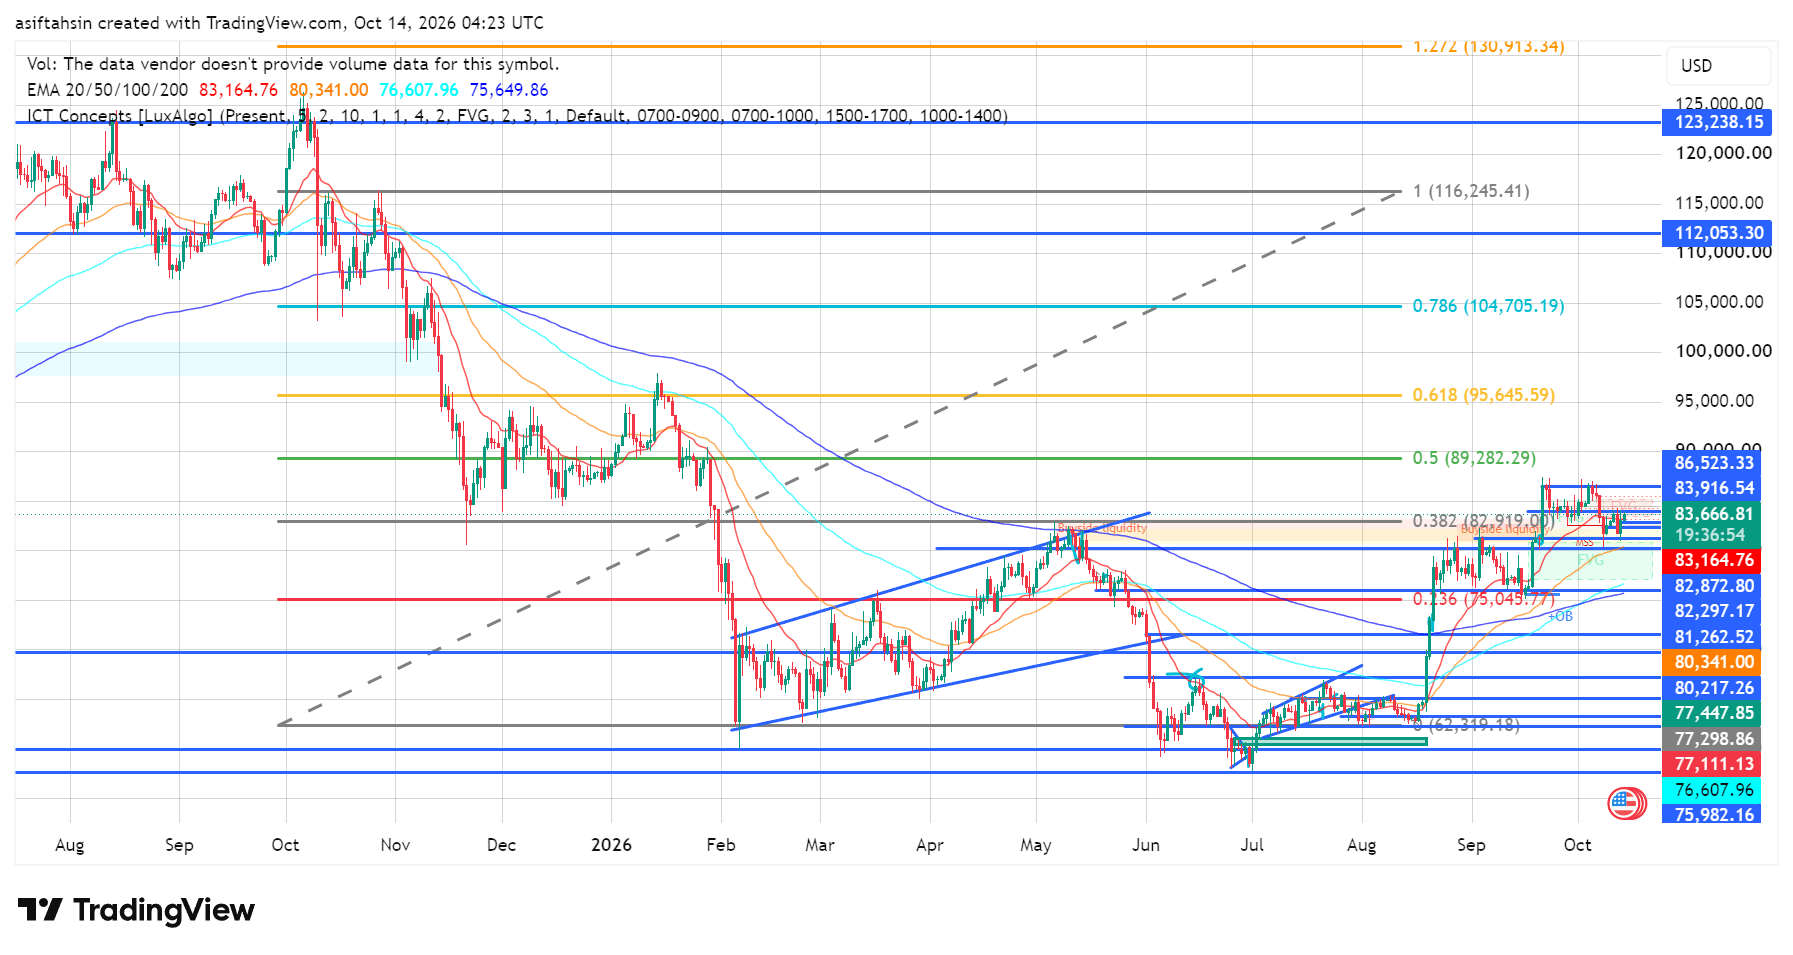
BTC formed a major low around $77,111–$77,448, followed by accumulation and a recovery toward the $83,000–$86,000 region.
The subsequent move reclaimed several important support levels and pushed price above the 0.382 Fibonacci level.
The current consolidation around $82,872–$83,916 is the key decision area. A breakout above $86,523 could transition the recovery into another expansion phase, while a loss of $82,872 could trigger a deeper liquidity sweep toward lower support.
📊 RSI Momentum
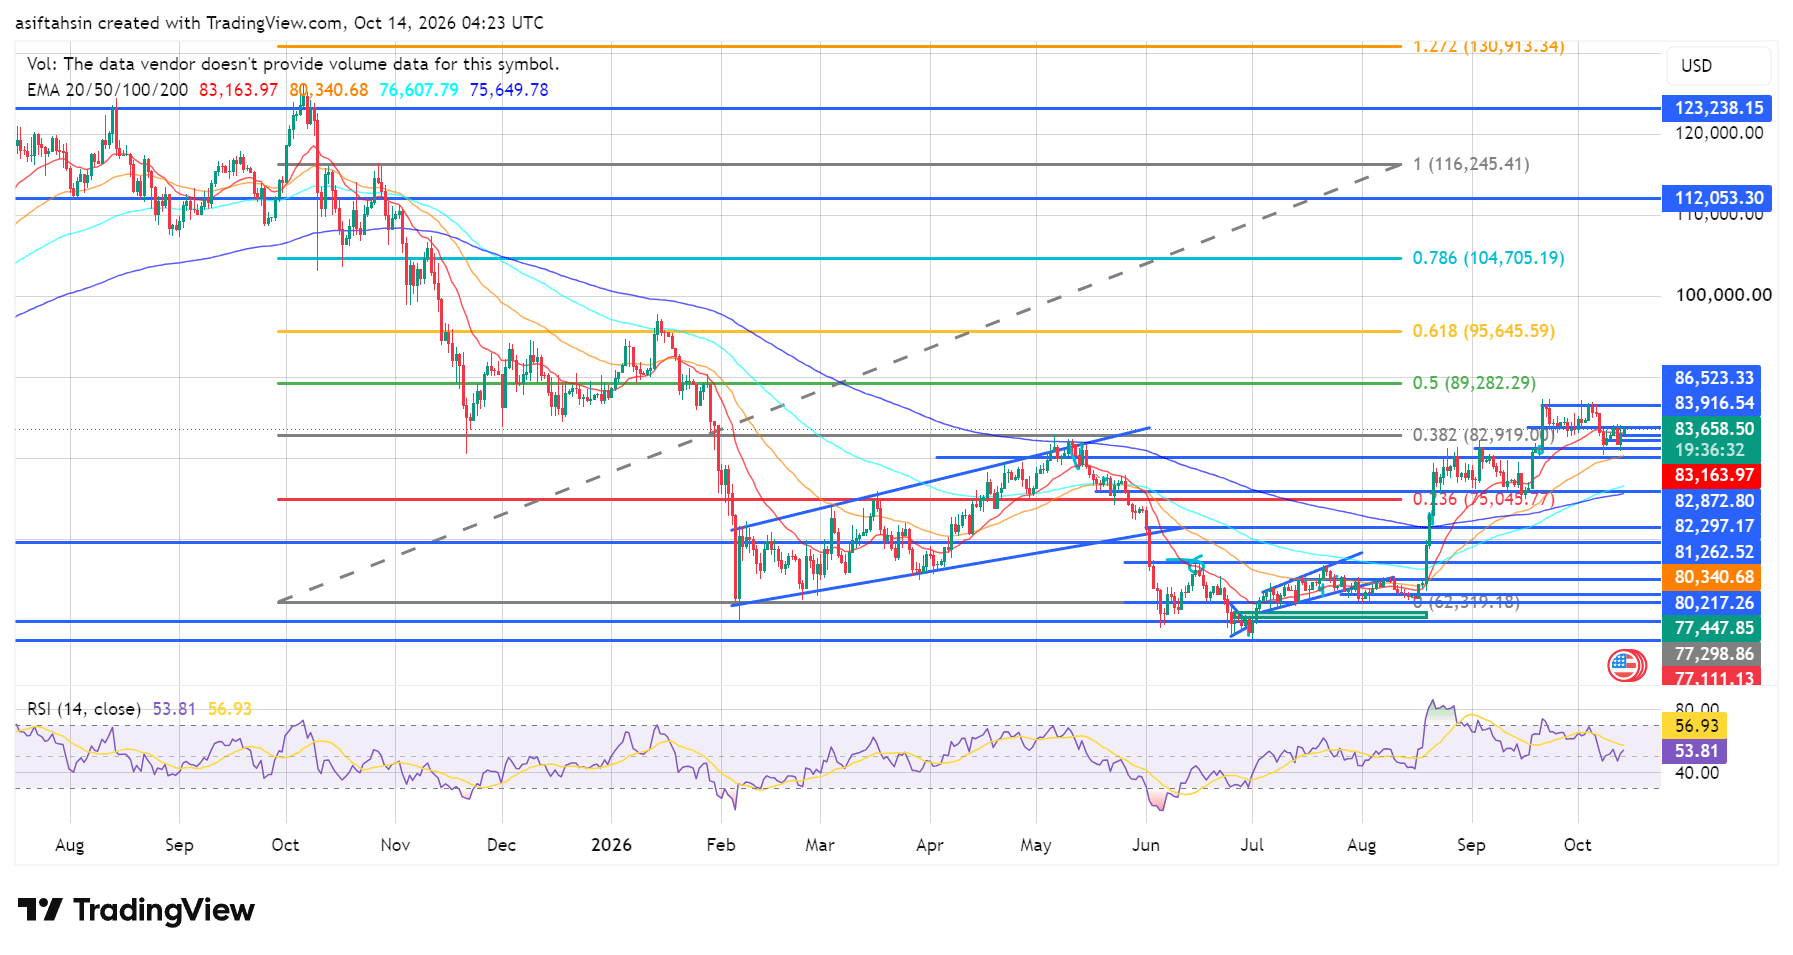
RSI: 53.81
RSI MA: 56.93
RSI remains above the 50 midpoint, suggesting moderately positive momentum. However, it is currently below its moving average, indicating that bullish momentum has not fully strengthened.
A move higher in RSI alongside a breakout above $86,523 would support the continuation scenario.
If RSI falls below 50 while BTC loses nearby support, the probability of further consolidation or a deeper pullback could increase.
🎯 Key Levels
Resistance:
$83,916.54 → $86,523.33 → $89,282.29 → $95,645.59 → $104,705.19 → $112,053.30
Support:
$83,163.97 → $82,919.00 → $82,872.80 → $82,297.17 → $81,262.52 → $80,340.68 → $80,217.26 → $77,447.85
Major EMA Support:
20 EMA: $83,163.97
50 EMA: $80,340.68
100 EMA: $76,607.79
200 EMA: $75,649.78
📌 Final Outlook
BTC's recovery structure remains constructive while price holds above the $82,872–$82,919 support region.
The immediate battle is between $83,916.54 resistance and the major $86,523.33 breakout level.
A sustained breakout above $86,523 could open the path toward $89,282, $95,645 and $104,705.
On the downside, losing $82,872 would weaken the short-term structure, while a break below $81,262–$80,217 could signal a deeper pullback toward the $77,000 support zone.
Bias: Recovery structure remains constructive above $82,919. Sustained strength above $86,523 could open the path toward $89,282, $95,645 and $104,705 next.
