


Many Bitcoin traders use the RSI indicator to identify potential buying and selling opportunities.
But here's a common mistake:
When RSI goes above 70, they sell. When it falls below 30, they buy.
That sounds simple—but the market doesn't always work that way.
Bitcoin can remain overbought during a strong rally. It can also remain oversold during a powerful downtrend.
So how should traders actually use RSI?
Let's break it down.

1. What Is RSI?
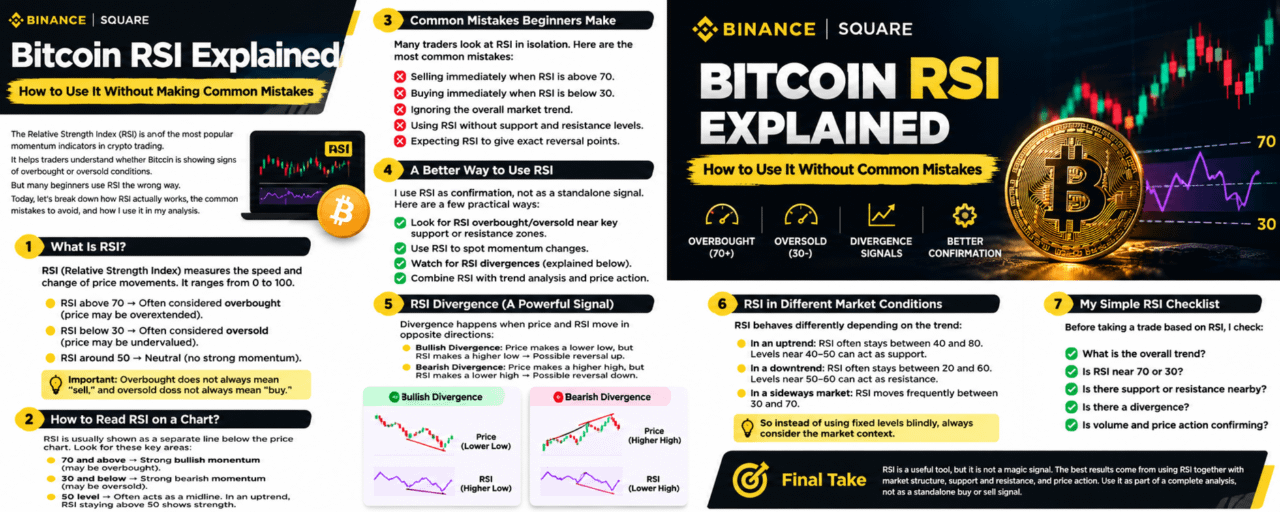
The Relative Strength Index (RSI) is a momentum indicator that measures the speed and magnitude of recent price movements.
It moves between 0 and 100.
The standard RSI setting uses 14 periods, although traders can adjust it to suit their strategy.
Traditionally, traders interpret the indicator like this:
RSI above 70: Potentially overbought.
RSI below 30: Potentially oversold.
RSI around 50: A useful midpoint for evaluating momentum.
These are guidelines, not automatic trading signals.
An overbought market can continue rising, and an oversold market can continue falling.
2. How to Read RSI on a Bitcoin Chart
Imagine Bitcoin is moving higher and its RSI rises from 45 to 68.
This suggests bullish momentum has strengthened.
Now imagine RSI crosses above 70.
Does that mean you should immediately sell BTC?
Not necessarily.
If Bitcoin is in a strong uptrend, the RSI may stay elevated while price continues to rise.
Instead of selling simply because RSI is above 70, examine the trend, nearby resistance, candle behaviour, and whether momentum is actually weakening.
The goal is to understand the market condition—not react blindly to a number.
3. What Does Oversold RSI Mean?
Suppose Bitcoin declines sharply and RSI drops below 30.
Some traders interpret this as a sign that selling pressure has become intense relative to recent price action.
However, oversold does not mean that Bitcoin must bounce immediately.
In a strong downtrend, sellers may remain in control for longer than expected.
A more cautious approach is to look for additional evidence, such as:
Price stabilising near a significant support zone.
Selling momentum beginning to weaken.
A bullish divergence forming.
Price reclaiming an important short-term level.
Even when these factors align, a reversal is not guaranteed.
4. RSI Divergence: A Signal Worth Watching
Divergence occurs when price and RSI move in different directions.
There are two common types.
Bullish divergence
Bitcoin makes a lower low, while RSI makes a higher low.
This may indicate that bearish momentum is weakening.
Bearish divergence
Bitcoin makes a higher high, while RSI makes a lower high.
This may indicate that bullish momentum is weakening.
But divergence is not a perfect reversal signal. It can appear well before a meaningful price change, and sometimes price continues in its original direction.
For better context, look for divergence near important support or resistance zones and wait for price-action confirmation.
5. Why RSI Works Differently in Different Markets
RSI should not be interpreted in isolation because market conditions matter.
During an uptrend: RSI can remain elevated for extended periods. A pullback toward the middle of its range may not necessarily mean the trend has reversed.
During a downtrend: RSI can remain weak for extended periods. A brief rise in RSI does not automatically signal a new bullish trend.
During a sideways market: RSI may be more useful for identifying momentum extremes near the boundaries of the trading range, but false signals are still possible.
This is why identifying the broader trend should come before interpreting an RSI reading.
6. Five Common RSI Mistakes Beginners Make
Mistake 1: Selling every time RSI crosses 70.
An overbought reading is not a guaranteed sell signal.
Mistake 2: Buying every time RSI falls below 30.
Oversold conditions can persist during strong downtrends.
Mistake 3: Ignoring support and resistance.
An RSI signal near an important price zone may have different significance from the same signal in the middle of a range.
Mistake 4: Treating divergence as a guaranteed reversal.
Divergence can provide a warning, but it does not confirm that a trend has changed.
Mistake 5: Ignoring risk management.
Even a well-reasoned RSI setup can fail. Decide in advance how much you are willing to risk and where your trading idea becomes invalid.
7. My Simple RSI Checklist Before a BTC Trade
Before considering a trade, I would ask:
What is the broader BTC trend?
Is RSI above 70, below 30, or near the midpoint?
Is price approaching a meaningful support or resistance zone?
Is RSI divergence present?
Does price action support the idea?
Where would the trade idea become invalid?
Is the potential reward worth the risk?
If RSI is the only reason for entering a trade, I would slow down and look for more confirmation.
Final Take
RSI is a useful tool for understanding momentum, but it cannot predict Bitcoin's next move with certainty.
Remember:
RSI above 70 = Potentially overbought, not an automatic sell.
RSI below 30 = Potentially oversold, not an automatic buy.
Divergence = A possible momentum warning, not a guaranteed reversal.
The strongest approach is to combine RSI with market structure, support and resistance, volume, price action, and disciplined risk management.
You don't need every indicator on your chart.
You need to understand the tools you use—and know their limitations.
How do you use RSI when analysing Bitcoin: overbought/oversold levels, divergence, or both?
Share your thoughts in the comments.
#Bitcoin #BTC #CryptoTrading #RSI #TechnicalAnalysis
Disclaimer: This article is for educational purposes only and does not constitute financial advice. Cryptocurrency trading involves substantial risk. Always do your own research and use appropriate risk management.