

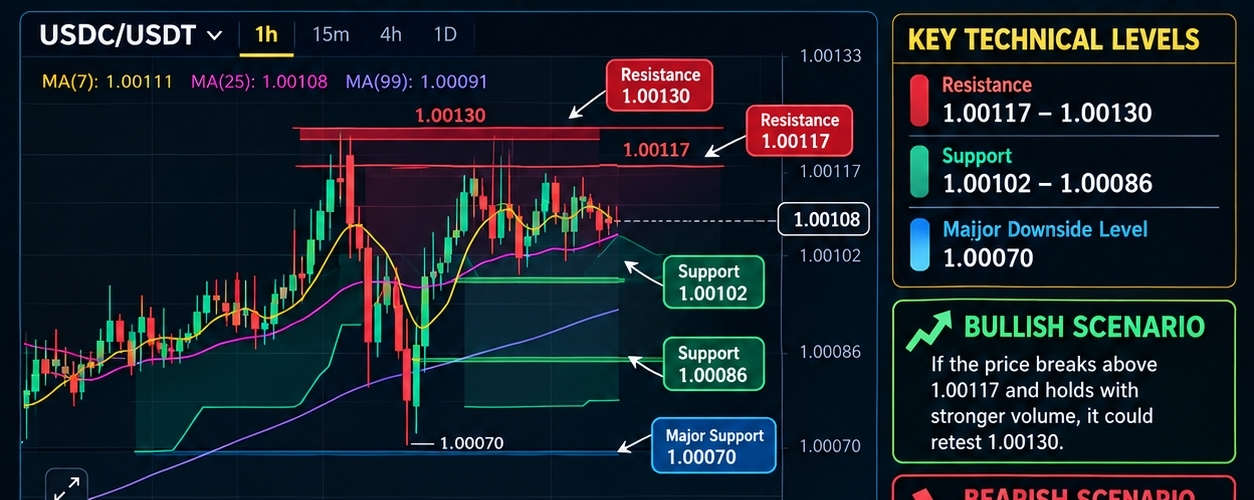

$USDC /$USDT is trading around 1.00108, showing a relatively stable price movement on the 1-hour chart. After recovering from the 1.00070 low, the price is now moving sideways, suggesting a battle between buyers and sellers.
🔍 Key Technical Levels:
Resistance: 1.00117 – 1.00130
Support: 1.00102 – 1.00086
Major downside level: 1.00070
📈 Bullish Scenario: If the price breaks above 1.00117 and holds that level with stronger volume, it could retest 1.00130.
📉 Bearish Scenario: If support around 1.00102 fails, the price may move toward 1.00086, with 1.00070 as a lower level to watch.
What the Indicators Suggest: The MACD histogram is slightly negative, while the short-term moving averages are clustered near the current price. This suggests weak short-term momentum rather than a confirmed breakout.
💡 My Strategy: Avoid chasing small price movements. Wait for a clear breakout or breakdown, confirm it with volume, and manage risk carefully.
Remember, USDC is a stablecoin designed to track the US dollar, so price fluctuations in this pair are generally small. Trading fees and spreads can outweigh potential gains.
Trade smart. Stay patient. Always DYOR. NFA.
#SeptemberCPIWatch USDC #BitcoinSurpasses$84K USDT #cryptouniverseofficial cryptoTrading #SeptemberCPIWatch TechnicalAnalysis #BinanceSquare #RiskManagement