


RsiRSI Indicator in Trading — Complete Guide..
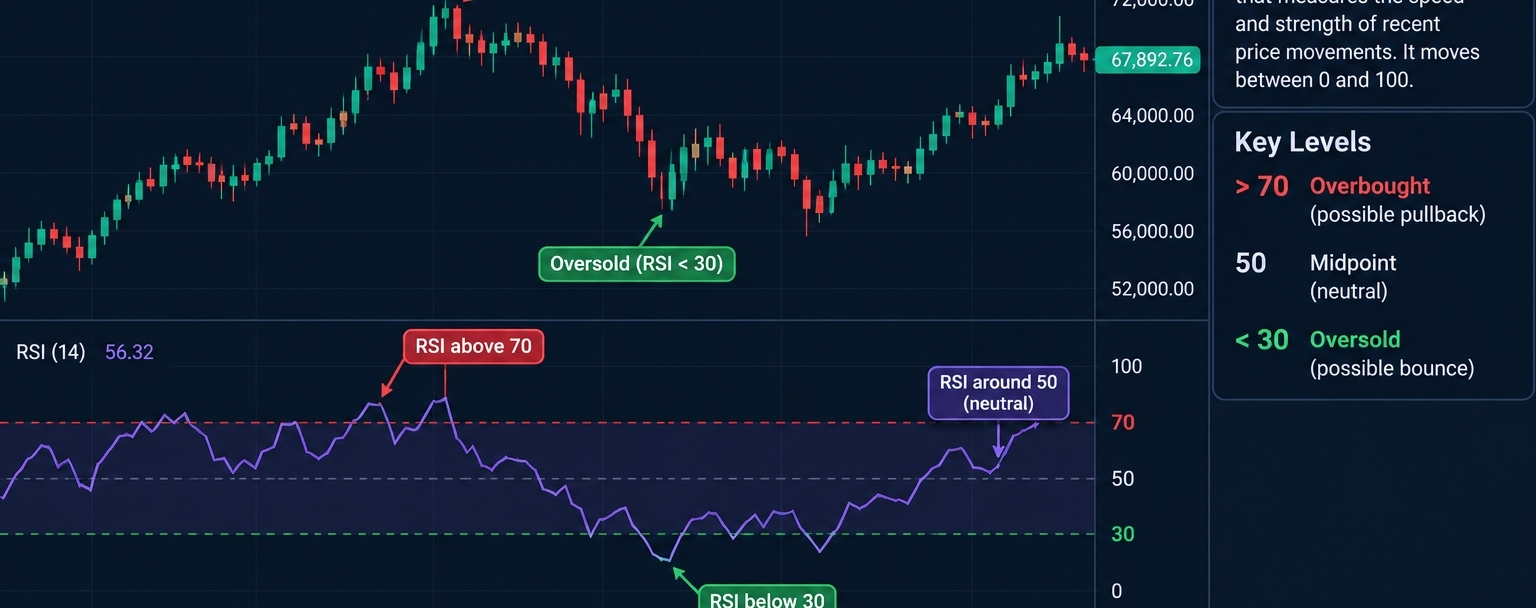
RSI stands for Relative Strength Index. It is a technical analysis indicator used in crypto, forex, and stock trading to measure the speed and strength of recent price movements.
Traders use RSI to identify:
🔥 Overbought conditions.
🟢 Oversold conditions.
📈 Bullish momentum.
📉 Bearish momentum.
🔄 Potential trend reversals.
⚡ Divergences between price and momentum.
1. What Is RSI?
RSI is an oscillator that moves between 0 and 100.
The traditional RSI uses a period of 14 candles, known as RSI (14).
For example:
RSI 80: Strong upward momentum, potentially overbought.
RSI 65: Relatively strong bullish momentum.
RSI 50: A neutral midpoint.
RSI 35: Relatively weak momentum.
RSI 20: Strong downward momentum, potentially oversold.
Important: Overbought does not automatically mean the price will fall, and oversold does not automatically mean it will rise.
RSI Divergence: A Powerful Trading Concept
Divergence occurs when the price moves in one direction but RSI moves differently.
Traders use divergence to identify potential changes in momentum.
There are two common types.
A. Bullish RSI Divergence 🟢
Bullish divergence occurs when:
Price makes a lower low.
RSI makes a higher low.
B. Bearish RSI Divergence 🔴
Bearish divergence occurs when:
Price makes a higher high.
RSI makes a lower high.
RSI + EMA: A Practical Trading Strategy
Since you are learning trading strategies, combining RSI with an Exponential Moving Average (EMA) can help you filter some weak signals.
For this example, use:
RSI (14)
EMA (50)
EMA (200)
You can apply this setup to crypto charts on TradingView.
🟢 Long Setup
Step 1: Identify the trend.
Price should generally be above EMA 200, indicating a potentially bullish broader trend.
Step 2: Check EMA 50.
Ideally, EMA 50 is also above EMA 200.
Step 3: Wait for a pullback.
Price retraces toward a support zone or EMA 50.
Step 4: Check RSI.
RSI might pull back toward 40–50 and then turn upward.
Step 5: Wait for confirmation.
Look for a bullish candle, a break of local structure, or another confirmation consistent with your strategy.
Step 6: Manage risk.
Place a stop-loss at a technically meaningful invalidation level and calculate your position size before entering.
Five Common RSI Trading Mistakes
Mistake 1: Selling every time RSI crosses 70.
A strong uptrend can keep RSI above 70 for an extended period.
Mistake 2: Buying every time RSI crosses below 30.
An asset can remain oversold while its price continues falling.
Mistake 3: Ignoring the broader trend.
An RSI buy signal during a strong bearish trend may fail.
Mistake 4: Entering before candle confirmation.
RSI can turn before the price establishes a reversal.
Mistake 5: Using RSI alone.
Combine RSI with price structure, support and resistance, and risk management.
RSI helps you understand momentum, not predict the future with certainty.
The most important concepts to remember are:
RSI above 70: Traditionally overbought.
RSI below 30: Traditionally oversold.
RSI above 50: Often associated with bullish momentum.
RSI below 50: Often associated with bearish momentum.
Bullish divergence: Price makes a lower low while RSI makes a higher low.
Bearish divergence: Price makes a higher high while RSI makes a lower high.