
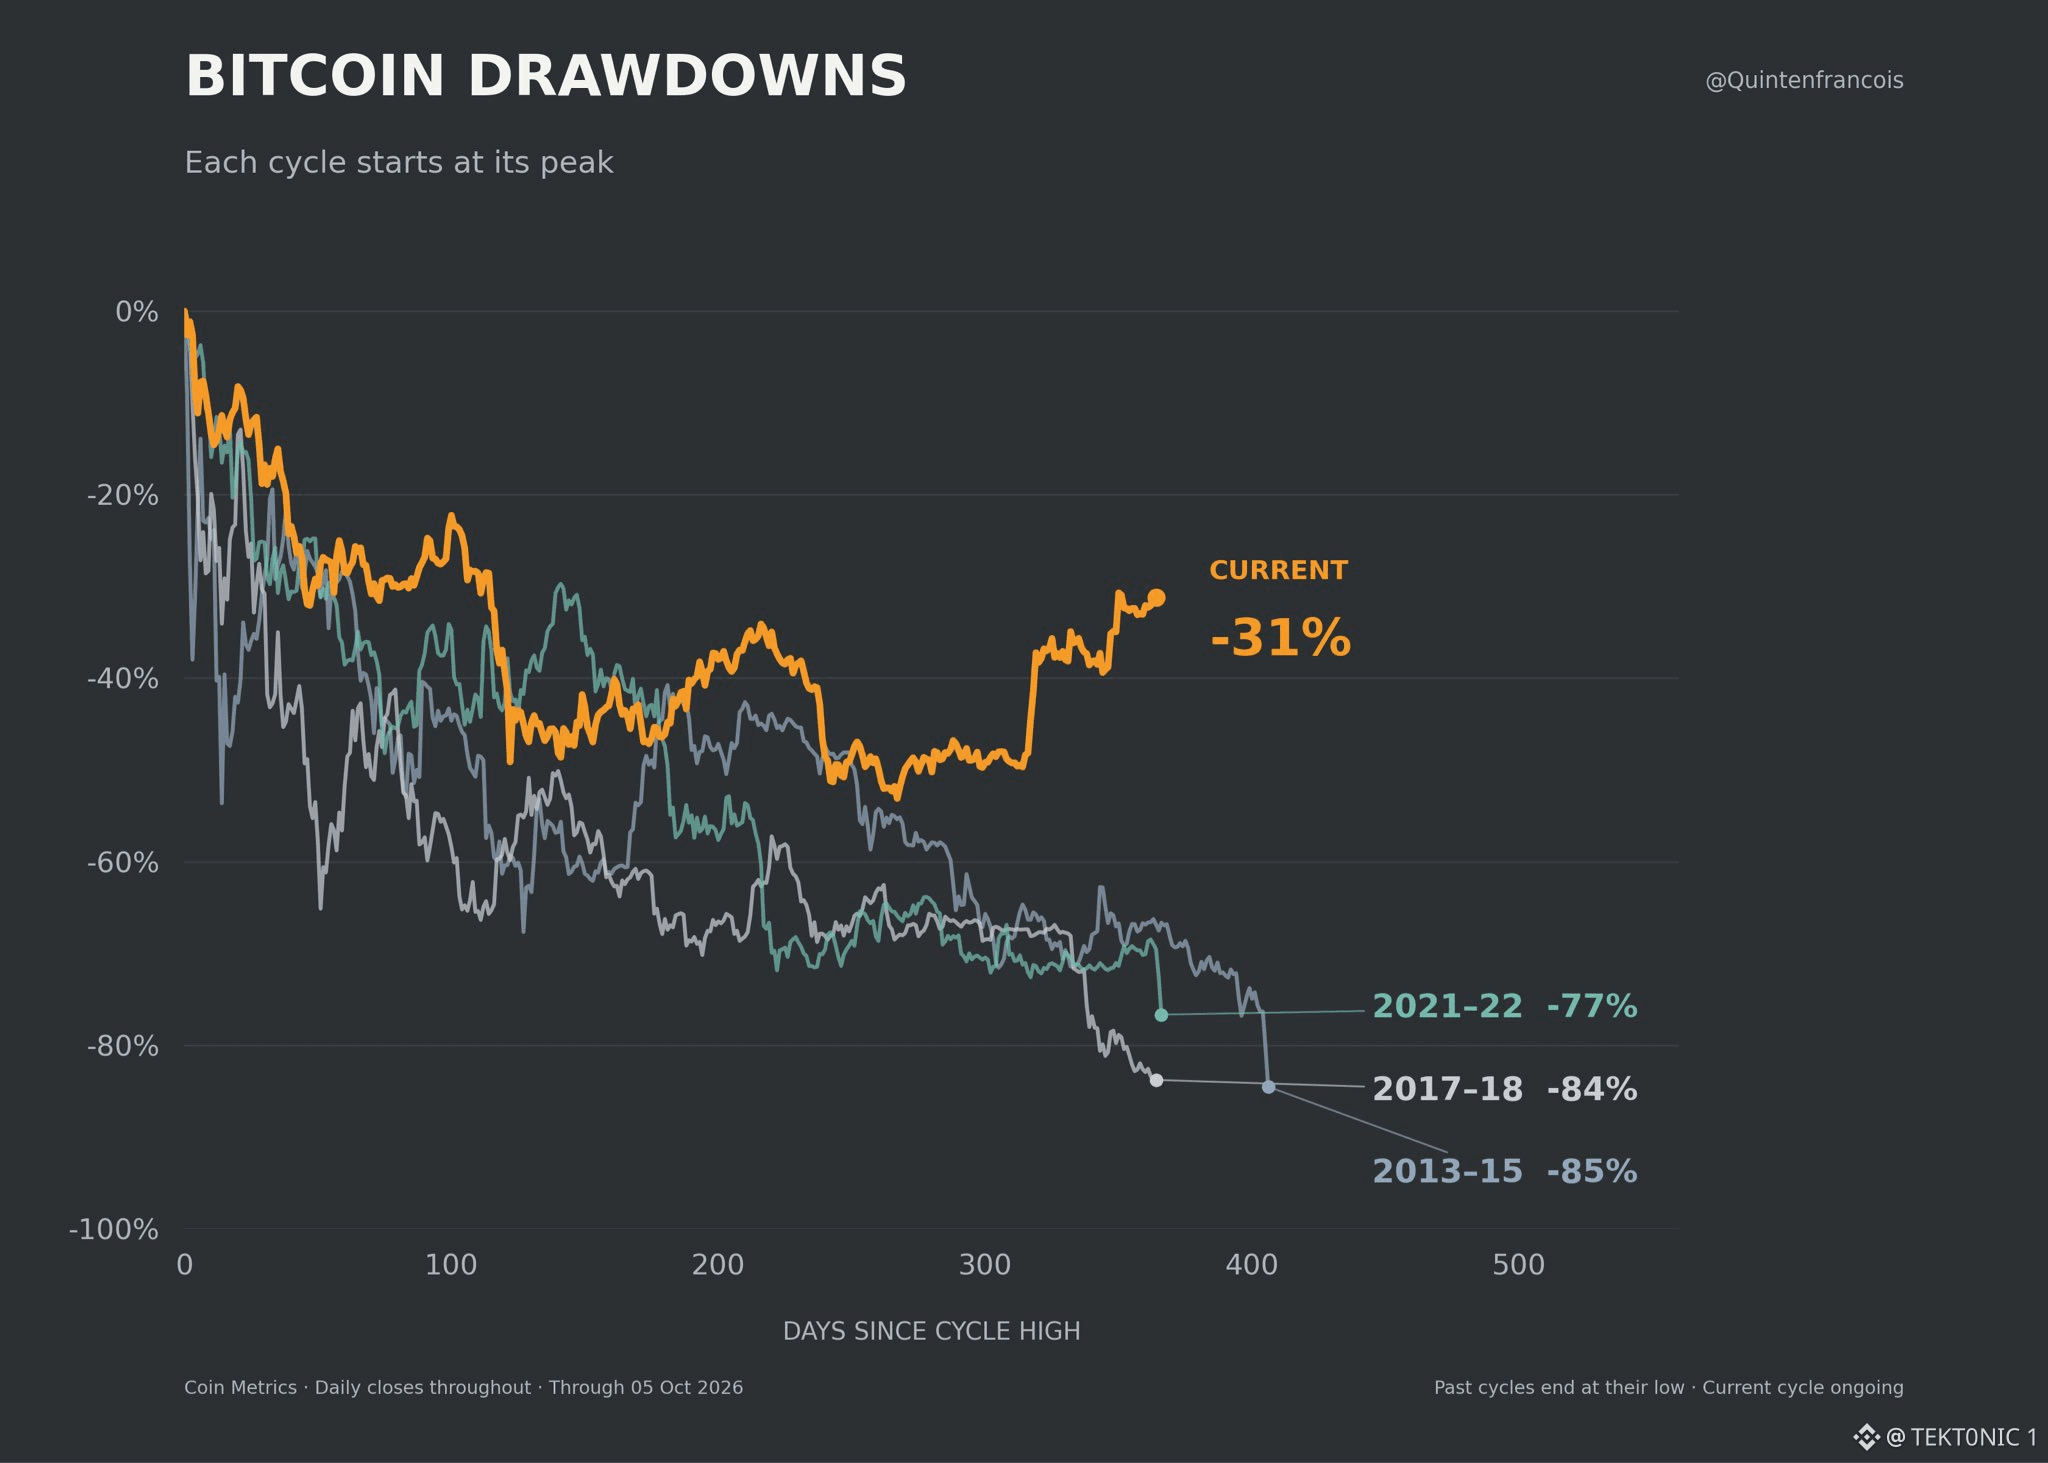
This $BTC cycle is still only 31% under its high. the chart, from Coin Metrics through October 5, starts each cycle at its peak. The current drawdown is −31%, about a year on. The last three finished much deeper: 2021–22 at −77%, 2017–18 at −84%, and 2013–15 at −85%. a −31% drawdown from the October 2025 high near $125,000 puts price around $86,000. That matches where Bitcoin is trading. The prior cycles did not stop at −30%. They kept falling for 300 to 400 days and ended at the low. this one has not ended. The chart says the past cycles are closed at their lows, and the current one is ongoing. A shallower path so far is the ETF and corporate bid. It is not a finished cycle. −31% is the number. −77% is what the last one did. The difference holds only if this low is already in. #BTC Price Analysis# #Bitcoin Price Prediction: What is Bitcoins next move?# $BTC $ETH


نشر
إخلاء مسؤولية: يتضمن آراء جهات خارجية. لا تُعدّ نصيحة. يُمكن استخدام Binance AI دون أي ضمان. اطلع على الشروط والأحكام.