DAILY SIGNAL — SOL/USDT
Date: 07 Oct 2026 Timeframe: 1m Intraday Bias: Support reaction → potential bullish continuation
📊 Market Bias
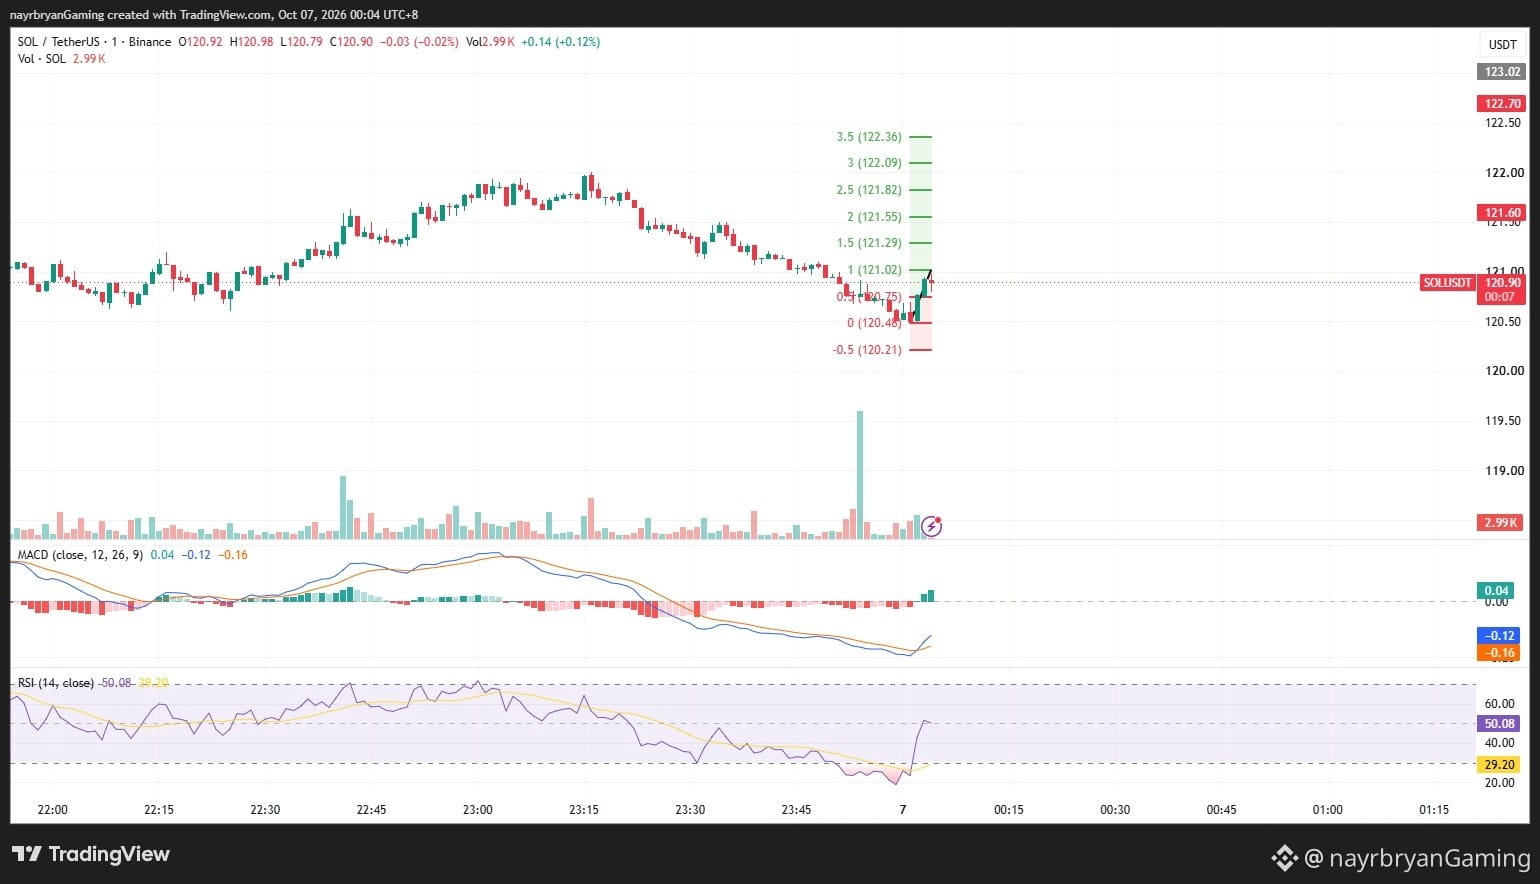
SOL is reacting from the 120.48–120.70 support zone after a sharp intraday pullback from the 122.00 area.
Price briefly dipped toward the lower Fibonacci area before recovering back above the purple structure zone.
The current reaction suggests buyers are defending support, but confirmation is still needed above the nearby 121.02 level.
🔹 Key Levels From Chart
Current Price: 120.81
Support Zone: 120.48 – 120.70
Key Reclaim: 121.02
Major Resistance: 121.29 – 121.55
Lower Invalidation: 120.21
🎯 Fibonacci Levels
Upside:
TP1 → 121.02 (1.0 Fib) TP2 → 121.29 (1.5 Fib) TP3 → 121.55 (2.0 Fib) TP4 → 121.82 (2.5 Fib) TP5 → 122.09 (3.0 Fib) TP6 → 122.36 (3.5 Fib)
Downside:
120.48 → 120.21
📈 Technical Breakdown
SOL previously established a strong upward structure, reaching near 122.00 before entering a corrective decline.
The pullback has now reached the major purple support zone around 120.48–120.70.
Price reacted upward from this area, suggesting short-term demand is still present.
MACD histogram has turned positive, indicating improving short-term momentum, although the MACD lines remain below the zero line.
RSI is around 45.87, recovering from weaker levels but still below the 50 midpoint.
A reclaim and hold above 121.02 would strengthen the bullish continuation scenario toward 121.29 → 121.55 → 121.82.
If 120.48 fails, the next downside level visible on the chart is approximately 120.21.
🧠 Quick Insight
“Support creates opportunity, but confirmation creates confidence.”
⚠️ Disclaimer
This is personal market analysis, not financial advice. This chart framework is for educational purposes only.
Always DYOR / DYODD, manage risk properly, and avoid emotional trading.
— @nayrbryanGaming #SOL #SOLUSDT #Crypto #Trading #TechnicalAnalysis #PriceAction #Fibonacci #Binance #DYOR #NFA #NoFOMO
Date: 07 Oct 2026 Timeframe: 1m Intraday Bias: Support reaction → potential bullish continuation
📊 Market Bias
SOL is reacting from the 120.48–120.70 support zone after a sharp intraday pullback from the 122.00 area.
Price briefly dipped toward the lower Fibonacci area before recovering back above the purple structure zone.
The current reaction suggests buyers are defending support, but confirmation is still needed above the nearby 121.02 level.
🔹 Key Levels From Chart
Current Price: 120.81
Support Zone: 120.48 – 120.70
Key Reclaim: 121.02
Major Resistance: 121.29 – 121.55
Lower Invalidation: 120.21
🎯 Fibonacci Levels
Upside:
TP1 → 121.02 (1.0 Fib) TP2 → 121.29 (1.5 Fib) TP3 → 121.55 (2.0 Fib) TP4 → 121.82 (2.5 Fib) TP5 → 122.09 (3.0 Fib) TP6 → 122.36 (3.5 Fib)
Downside:
120.48 → 120.21
📈 Technical Breakdown
SOL previously established a strong upward structure, reaching near 122.00 before entering a corrective decline.
The pullback has now reached the major purple support zone around 120.48–120.70.
Price reacted upward from this area, suggesting short-term demand is still present.
MACD histogram has turned positive, indicating improving short-term momentum, although the MACD lines remain below the zero line.
RSI is around 45.87, recovering from weaker levels but still below the 50 midpoint.
A reclaim and hold above 121.02 would strengthen the bullish continuation scenario toward 121.29 → 121.55 → 121.82.
If 120.48 fails, the next downside level visible on the chart is approximately 120.21.
🧠 Quick Insight
“Support creates opportunity, but confirmation creates confidence.”
⚠️ Disclaimer
This is personal market analysis, not financial advice. This chart framework is for educational purposes only.
Always DYOR / DYODD, manage risk properly, and avoid emotional trading.
— @nayrbryanGaming #SOL #SOLUSDT #Crypto #Trading #TechnicalAnalysis #PriceAction #Fibonacci #Binance #DYOR #NFA #NoFOMO