



Key Highlights
Bitcoin is trading at $85,771 (-0.70% 24h) with a $1.72T market cap as the midterm pattern resurfaces
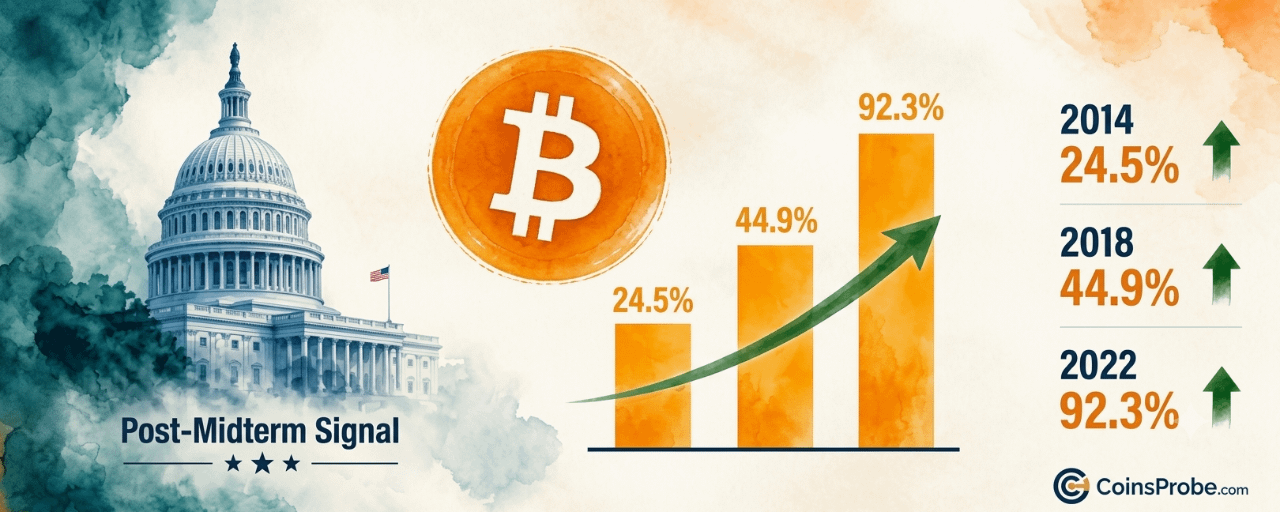
Bitcoin gained 24.5%, 44.9%, and 92.3% in the 12 months after the 2014, 2018, and 2022 midterms — per @xwinfinance via CryptoQuant
All three post-midterm windows showed rising active addresses alongside price — currently at 558.6K on CryptoQuant's chart
The pattern is three-for-three across three cycles; the next U.S. midterm window opens November 2026
Bitcoin is trading at $85,771 — down 0.70% over the past 24 hours, with a market capitalization of approximately $1.72 trillion. That current softness sits against a three-cycle historical pattern that is difficult to dismiss: every time the United States has held midterm elections since 2014, Bitcoin has posted a double-digit gain in the twelve months that followed.
The pattern was surfaced by analyst @xwinfinance and published by CryptoQuant (@cryptoquant_com): “Bitcoin gained 24.5%, 44.9% and 92.3% in the twelve months after the 2014, 2018 and 2022 midterms.” Three elections. Three gains. The smallest was nearly 25%. The largest was almost 93%.
Signal 1 — The S&P 500 Post-Midterm Pattern
The first chart shared by CryptoQuant shows the S&P 500 from approximately 2017 through October 2026, with two red rectangles overlaid on the twelve months following the 2018 and 2022 midterm elections. The index is currently labeled at 7,791.59 on the chart’s right axis. Both highlighted windows — 2019 and 2023 — show relative consolidation phases within a broader long-term uptrend, establishing that post-midterm periods have historically represented constructive environments for risk assets broadly, not just Bitcoin.
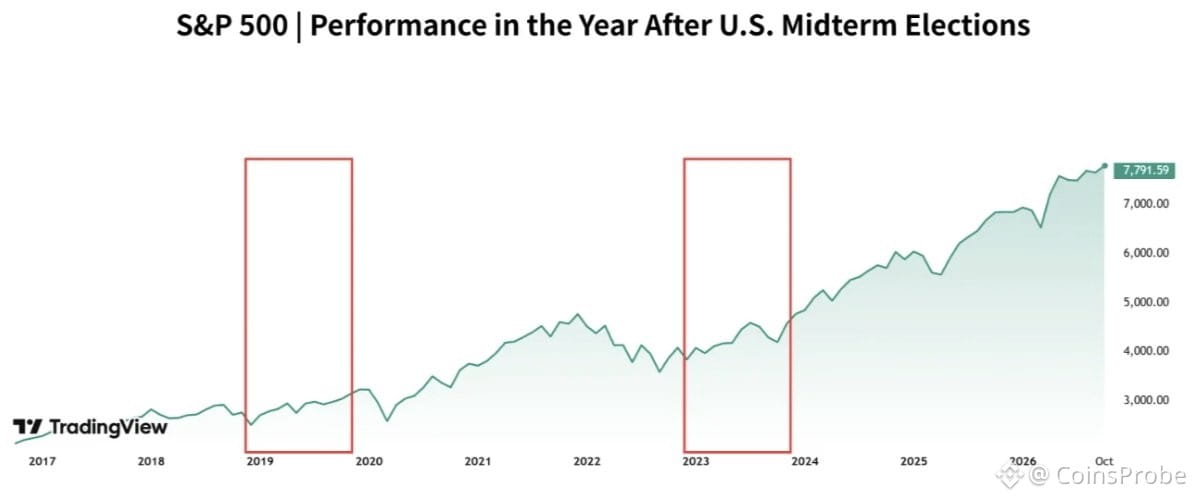
Chart 1 of 2: Chart Analysis | Source: @cryptoquant_com (X)
The mechanism is political, not monetary. U.S. midterm elections historically reduce legislative gridlock uncertainty. When one party controls Congress and another the White House, major fiscal disruptions become harder to pass — markets tend to price in policy stability. That stability environment has historically favored equities and, by extension, Bitcoin as a macro-correlated risk asset during the twelve months that follow.
Signal 2 — Bitcoin’s Three-for-Three Midterm Track Record
The second chart plots Bitcoin price against active addresses from 2010 through 2026. Three red rectangles mark the twelve-month windows after the 2014, 2018, and 2022 midterm elections. In each window, both the price line and active addresses rose. The chart’s current price label reads $85,736K — consistent with the live price at time of writing. Active addresses are labeled at 558.6K, providing network activity context alongside the price data.
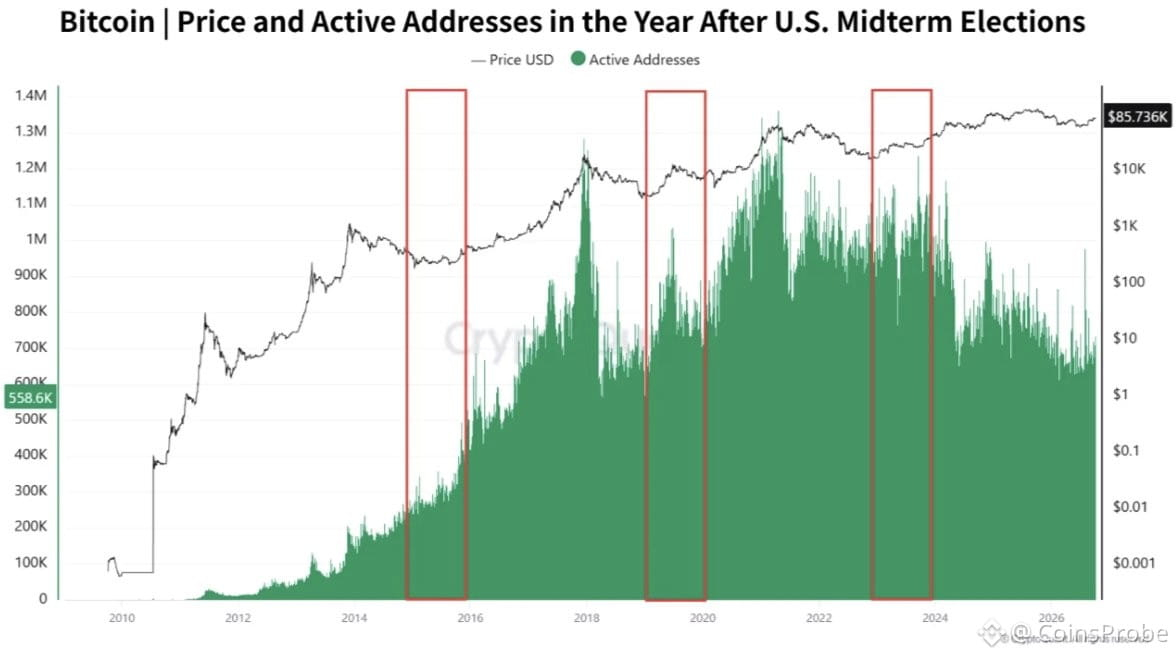
Source: @cryptoquant_com (X)
The exact numbers from the analyst’s note:
Midterm Year 12-Month Bitcoin Gain (Post-Election) 2014 +24.5% 2018 +44.9% 2022 +92.3%
Source: @xwinfinance via CryptoQuant
The 2022 cycle is the most recent data point. The November 2022 midterms occurred at one of Bitcoin’s lowest points of that bear market — below $17,000. The 92.3% gain in the following twelve months brought Bitcoin back toward the $33,000 range by November 2023. That recovery was driven by genuine accumulation, the Bitcoin spot ETF filing cycle, and the broader macro pivot that characterized late 2023 — not purely the midterm calendar effect. The pattern held regardless of its internal drivers.
The 2024 midterms have not yet occurred — the next U.S. midterm elections are scheduled for November 2026. The current signal from the analyst’s framing is based on the post-2022 midterm window, which by this reading places Bitcoin within or nearing the end of the twelve-month post-midterm strength period that began in November 2022. The 92.3% twelve-month gain that followed the 2022 midterms is the most recent completed instance of this pattern. Traders tracking the 2026 midterm cycle would be watching for a new twelve-month window beginning after November 2026.
What the Pattern Says — And What It Doesn’t
Three instances is not a law. It is a track record. Every data point in the set shows a positive outcome, and the magnitude has increased with each cycle — from 24.5% to 44.9% to 92.3%. But the sample size means that a single non-confirming cycle would bring the hit rate to 75%, not invalidate the thesis entirely.
The active addresses data in the second chart matters here. Each of the three post-midterm windows also saw elevated network activity — not just price appreciation. Network activity rising alongside price is a structurally different signal than price rising on purely speculative positioning. The 558.6K active addresses currently labeled on the chart provide a baseline for monitoring whether network engagement is expanding or contracting as the next cycle window opens.
What the pattern does not say: it does not specify the starting price for the twelve-month window, the peak timing within that window, or whether gains accrue linearly or in compressed bursts. The 2022-cycle gain of 92.3% was heavily back-weighted toward late 2023 and early 2024 — not spread evenly across twelve months.
Bullish Scenario
If the post-2022 midterm pattern continues to compound — with the 2026 cycle producing a third successive gain above the 44.9% 2018 benchmark — Bitcoin entering its next post-midterm window at current prices near $85,771 would represent a structurally favorable entry context. The analyst’s stated range of 24.5%–92.3% across three prior cycles defines the historical performance envelope.
Bearish Scenario
The pattern has no confirmed failure mode from prior cycles. The risk is that the 2026 midterm window begins under materially different macro conditions — elevated real rates, dollar strength, or a risk-off regime — that override the political-calendar effect. No specific invalidation level is stated in the analyst’s note, and none should be inferred from the chart alone.
Bitcoin’s three-for-three midterm track record — 24.5%, 44.9%, and 92.3% across 2014, 2018, and 2022 — is a documented pattern with increasing magnitude and corroborating network activity data in each instance. CryptoQuant and @xwinfinance are not projecting a fourth repetition: they are presenting the historical record. At $85,771 with active addresses at 558.6K, the metric to track heading into the 2026 midterm window is whether network activity follows price — as it did in all three prior confirmed instances.
Watch active addresses at the 558.6K baseline as the first confirmation level for whether the pattern’s network component is setting up for the next cycle.
Disclaimer: The views and analysis presented in this article are for informational purposes only and reflect the author’s perspective, not financial advice. Technical patterns and indicators discussed are subject to market volatility and may or may not yield anticipated results. Investors are advised to exercise caution, conduct independent research, and make decisions aligned with their individual risk tolerance.