



The crypto market serves up a tense standoff for the Ena price as of October 5, 2026, with the token trading at $0.2559 on Binance, caught between a daily chart that still looks constructively bullish and an hourly tape digesting an overbought move in real time.
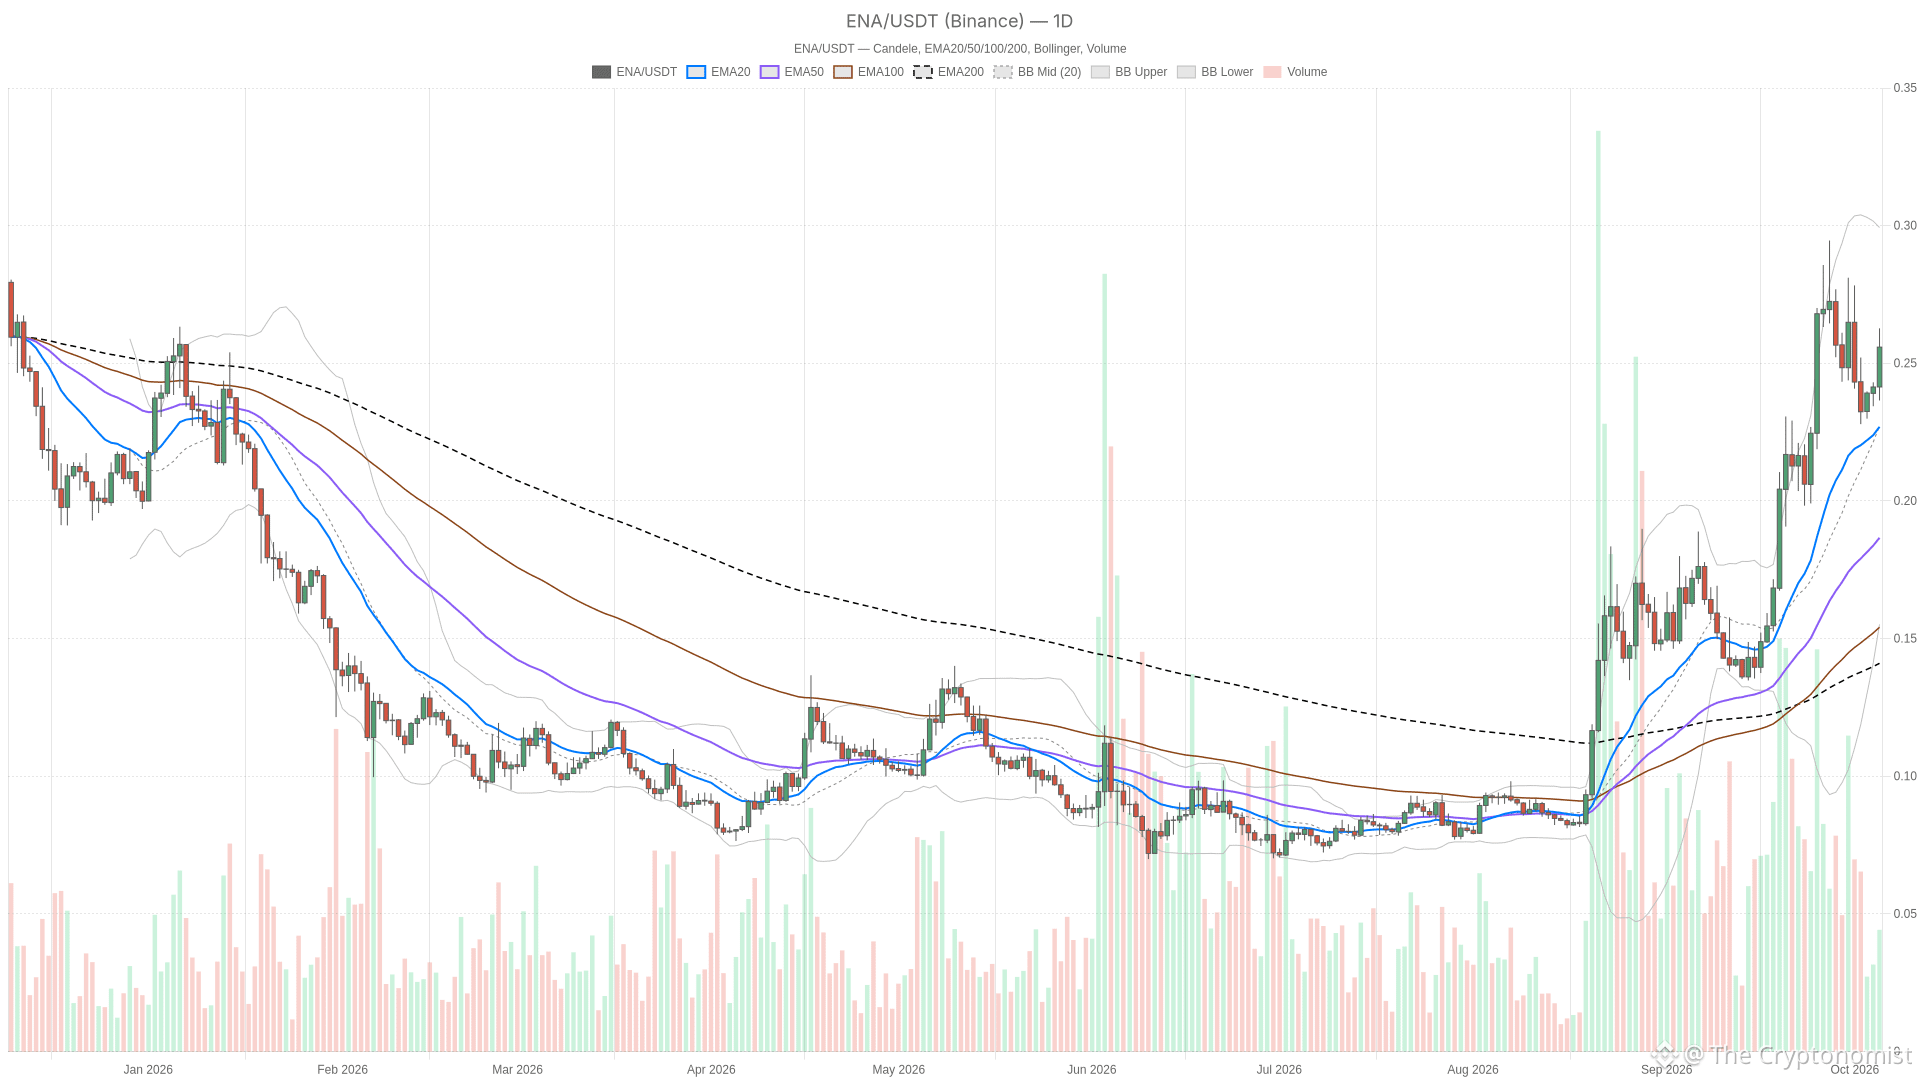 ENA/USDT — daily chart with candlesticks, EMA20/EMA50 and volume.
Key takeaways
ENA trades at $0.2559 on Binance while its daily EMAs remain stacked in a textbook bullish order.
Hourly RSI has reached 73.6, signaling overbought conditions that may require consolidation before the next leg.
The daily MACD histogram has turned negative at -0.00228, indicating fading momentum despite the intact trend structure.
Total crypto market capitalization sits near $2.91 trillion, with Bitcoin dominance at 59.22%, creating a mildly pressured backdrop for altcoins.
The Fear & Greed Index reads 70 (Greed), supporting risk appetite but also raising the odds of stretched positioning.
What’s Moving ENA: Market Backdrop and Risk Appetite
The broader crypto market is under mild pressure, with total market capitalization down 2.81% at roughly $2.91 trillion and Bitcoin dominance elevated at 59.22%, yet ENA’s resilience above its daily moving averages stands out against this backdrop. That combination — a market cap pullback alongside still-high Bitcoin dominance — typically means altcoins are absorbing more of the pressure than Bitcoin itself, which makes ENA’s position above its daily EMAs somewhat notable rather than automatic.
The Fear & Greed Index from Alternative.me reads 70, squarely in Greed territory. That is a sentiment backdrop that usually supports risk-taking, but it also raises the odds that positioning is getting a little ahead of itself — which lines up with what the hourly RSI is showing on ENA specifically.
Trend Structure: Daily EMAs Stay Bullish, Hourly Order Turns Mixed
ENA’s daily trend remains structurally bullish with all three major EMAs stacked in proper ascending order, but the hourly chart displays a less organized alignment that complicates the near-term outlook. On the daily chart, ENA trades above its EMA20 ($0.2239), EMA50 ($0.1838) and EMA200 ($0.1399), with the averages stacked in a textbook bullish order — EMA20 above EMA50 above EMA200. The daily regime reads as bullish, and nothing in the moving-average structure contradicts that.
The hourly picture complicates things. Price is still above its EMA20 ($0.2453), EMA50 ($0.2420) and EMA200 ($0.2446), but the order between those averages is not aligned — the EMA20 sits above the EMA200, which in turn sits above the EMA50, so the structure is mixed rather than clean. On the 15-minute chart the averages snap back into bullish order, with the EMA20 at $0.2539, EMA50 at $0.2483 and EMA200 at $0.2419 all below price, which tells you the very short-term trend is intact even as the hourly skeleton looks less organized.
Momentum and Volatility: Hourly RSI Stretches While Daily MACD Rolls Over
The hourly RSI has reached overbought territory at 73.6 and continues climbing, while the daily MACD histogram turns increasingly negative, creating a momentum-versus-structure split that defines the current setup. Daily RSI sits at 60.2, rising over its last three closed readings from 57.8 to 59.6 to 60.2 — momentum building, but nowhere near overbought. The daily MACD tells a different story: the histogram has crossed below the zero line and is losing ground, now at -0.00228 after reading -0.00135 and essentially flat before that.
The hourly RSI is the loudest signal on the board at 73.6, climbing from 62 to 69.6 to 73.6 over its last three closed candles — overbought and still rising. The hourly MACD histogram backs that up, widening on the positive side to +0.00196, which argues bullish momentum was still building into the move that just stalled. On the 15-minute chart, however, RSI is cooling from 68 down to 63 and then 60.7, and the MACD histogram is narrowing to +0.000248 — both consistent with the live pullback from the last closed 15-minute close of $0.2576 to the current level.
Bollinger Bands reinforce the overbought read on the hourly: price is pressing close to the hourly upper band at $0.25677, while on the daily chart there is considerably more room between price and the upper band at $0.30163, with the daily mid-band at $0.22144. Daily ATR14 of $0.0222 points to a market still capable of wide daily swings; hourly ATR14 of $0.0053 is far tighter, as expected for the shorter timeframe.
Key Levels and Scenarios for the Ena Price
Price has already cleared every daily pivot level, leaving the Bollinger upper band at $0.3016 as the next major resistance target, while the $0.2449 confluence zone now acts as the critical support shelf. The daily R1 at $0.2449, the pivot at $0.2396 and S1 at $0.2362 all sit below current price. Notably, that daily R1 at $0.2449 coincides with the hourly EMA200, which turns that zone into a more meaningful support cluster rather than just another isolated number.
On the hourly chart, the setup inverted after the pullback: price is now trading below its own S1 at $0.2562, the hourly Bollinger upper at $0.2568, the hourly pivot at $0.2594 and the hourly R1 at $0.2640 — all of those former reference points now sit above price and act as resistance rather than support. Below current price, the hourly EMA20 at $0.2453, EMA200 at $0.2446, Bollinger mid at $0.2434 and EMA50 at $0.2420 form the nearer support shelf.
The bullish case: a daily close above the Bollinger upper band at $0.3016 would confirm the uptrend has room to extend into fresh highs, something the daily EMA structure already supports. That scenario would be invalidated if price fails to hold the $0.2449 confluence — the daily R1 and hourly EMA200 together — on a daily close, which would point to the daily momentum rollover finally catching up with price.
The bearish case: a daily close below that same $0.2449 confluence level would flag a deeper retracement toward the daily pivot at $0.2396 and daily S1 at $0.2362, essentially unwinding the recent bullish momentum. That bearish read gets invalidated if ENA reclaims the hourly S1 at $0.2562 on an hourly close, which would signal the current pullback was just a reset of an overbought hourly RSI rather than a genuine trend shift. The clearest false signal risk here is treating the hourly overbought reading as an automatic reversal — the daily trend structure has not broken, and the 15-minute chart, while cooling, is still trading above all three of its EMAs.
FAQ
What is ENA’s current price and trend status?
ENA trades at $0.2559 on Binance as of October 5, 2026, after the last completed daily candle closed at $0.2414. The daily regime reads bullish, with price above all three major EMAs stacked in proper ascending order.
Is the daily trend for ENA bullish or bearish?
The daily trend remains structurally bullish, with price above its EMA20 ($0.2239), EMA50 ($0.1838) and EMA200 ($0.1399) in a textbook bullish stacking order, even though the daily MACD histogram has turned negative and is losing ground.
Why does the hourly RSI matter right now?
Hourly RSI sits at 73.6, in overbought territory and still climbing over its last three closed readings, which suggests the recent push may be due for consolidation even as the broader daily trend stays intact.
What would confirm a bullish continuation for ENA?
A daily close above the Bollinger upper band at $0.3016 would support a continuation scenario, while losing the $0.2449 confluence level — where the daily R1 meets the hourly EMA200 — on a daily close would undermine it.
Disclaimer: This article is for informational purposes only and does not constitute financial advice, an investment recommendation, or a solicitation to buy or sell any financial instrument or cryptocurrency. The analysis provided is not indicative of future results. Investing in crypto assets and financial markets carries a high risk of capital loss. Always do your own research (DYOR) and consult a qualified financial advisor before making any decision.
Article produced with the assistance of artificial intelligence and reviewed by the editorial team.