

I looked closely at the screenshot. Here’s what I see:
What the chart is showing
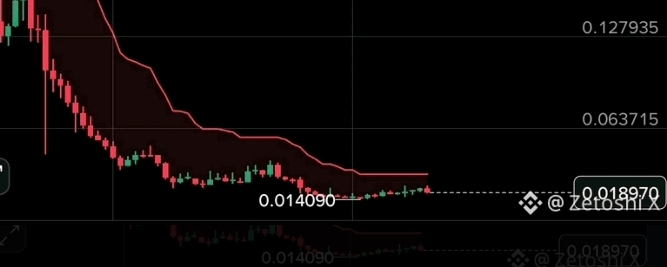
The token shown is around 0.018–0.019 on the right side.
Earlier, it was much higher and then experienced a large, sustained decline.
The price is now moving mostly sideways near the lows.
The red line appears to be a trend/indicator line that is still above the current price.
The screenshot labels a previous low around 0.014090.
The post claims that “whales are buying” and expects a 200–1000% rise while risking 20%.
My biggest concern 🚨
The chart does not prove that whales are accumulating. A sideways price near a major low can mean accumulation, but it can also simply mean that selling has slowed down.
And a claim like “200–1000%” is extremely speculative. Crypto assets can be exceptionally volatile, and regulators specifically warn that investors can lose substantial amounts in crypto.
Also, the statement “I lose only 20%” can be misleading. If leverage or a derivative position is involved, the actual risk depends on the position size, leverage, liquidation rules, and stop execution—not simply the percentage written in a post. Leverage can magnify losses very quickly.
My reading of the setup
Previous high
│
│ ╲
│ ╲
│ ╲
│ ╲
│ ╲
│ ╲
│ ╲
│ ╲____
│ ╲___ ← 0.014090 previous low
│ ╲___╱╲╱╲╱╲╱ ← current sideways area
│
└───────────────────────────────
↑
possible base
Important: a possible base is not confirmation of a reversal.
If you want to evaluate this screenshot seriously, the useful things to check would be volume, market-cap/liquidity, token supply/unlocks, recent news, and actual on-chain buying data rather than relying on the influencer's “whales are buying” statement.
I would not treat this screenshot alone as evidence that the token is about to rise 200–1000%.