
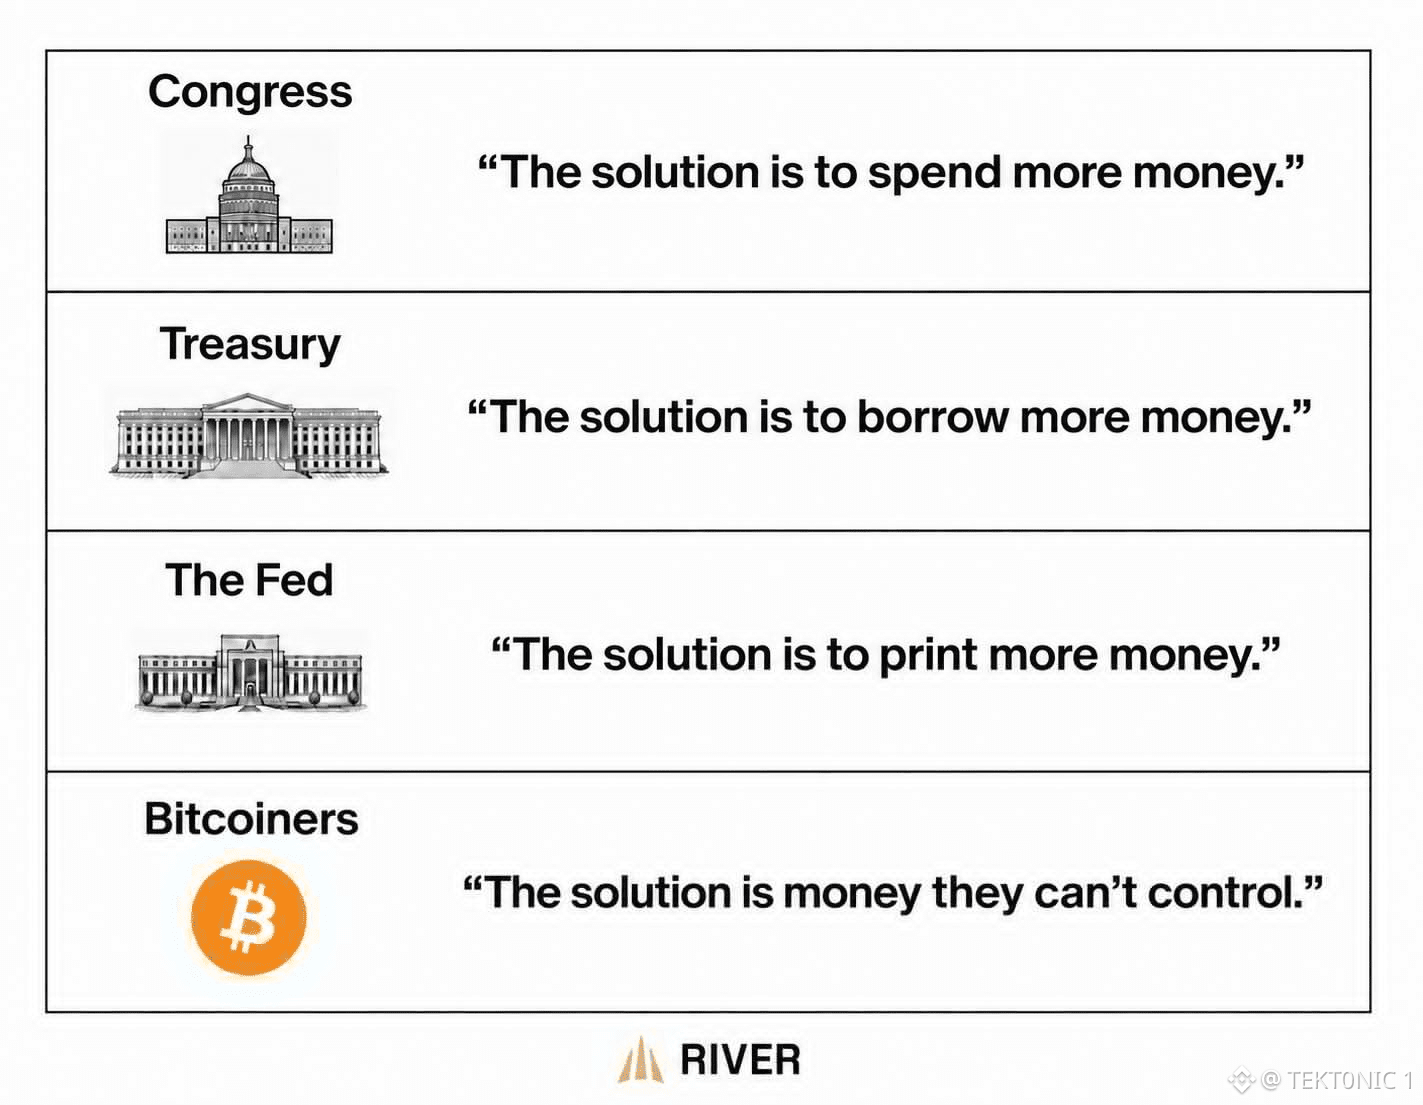
Congress spends, the Treasury borrows, and the Fed has been the buyer of last resort when the long end breaks. That is the loop in the River graphic. The numbers behind it are already on the tape this month. the 10-year yield hit 5.34%, the highest since 2002, even after the Treasury more than doubled its long-end buybacks. The 30-year mortgage rate is 7.28%, up from 2.65% in 2021. Inflation has sat above 2% for more than five years. A $4 billion to $6 billion buyback does not retire the debt. Issuance continues, and the Treasury market turns over more than $1 trillion a day. Bitcoin is the asset outside that loop. Supply is capped. No agency can expand it to fund a deficit. Exchange reserves are near 2.7 million $BTC , down from about 3.15 million in mid-2024. That is tighter inventory, not a claim that price only goes one way. It still fell from about $126,000 to the low $60,000s in this cycle. the way out is the supply rule, not the slogan. It holds if issuance keeps rising and the 10-year stays above 5%. It does not pay a mortgage at 7.28%. That spread is the cost of the system the graphic is describing. #BTC Price Analysis# #Bitcoin Price Prediction: What is Bitcoins next move?# $BTC $XRP #Macro Insights#


نشر
إخلاء مسؤولية: يتضمن آراء جهات خارجية. لا تُعدّ نصيحة. يُمكن استخدام Binance AI دون أي ضمان. اطلع على الشروط والأحكام.